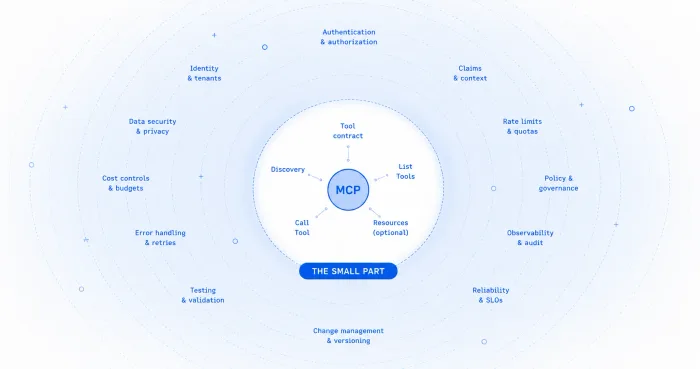
You get an MCP server running in an afternoon. Tool call goes in, result comes back, demo looks great. Then someone asks what happens when an agent calls the wrong customer's data. Or who approved that write. Or — after the first production incident — whether you can pull the trace for a specific tool invocation.
That's when the demo ends and the real question starts: how do you build this thing so it's defensible?
This post is the build reference for a governed MCP server in Koodisi — the full path from identity setup through client onboarding to per-invocation observability. What Is MCP? covers the strategic argument for the protocol itself. This is how you actually do it.
The identity layer comes first
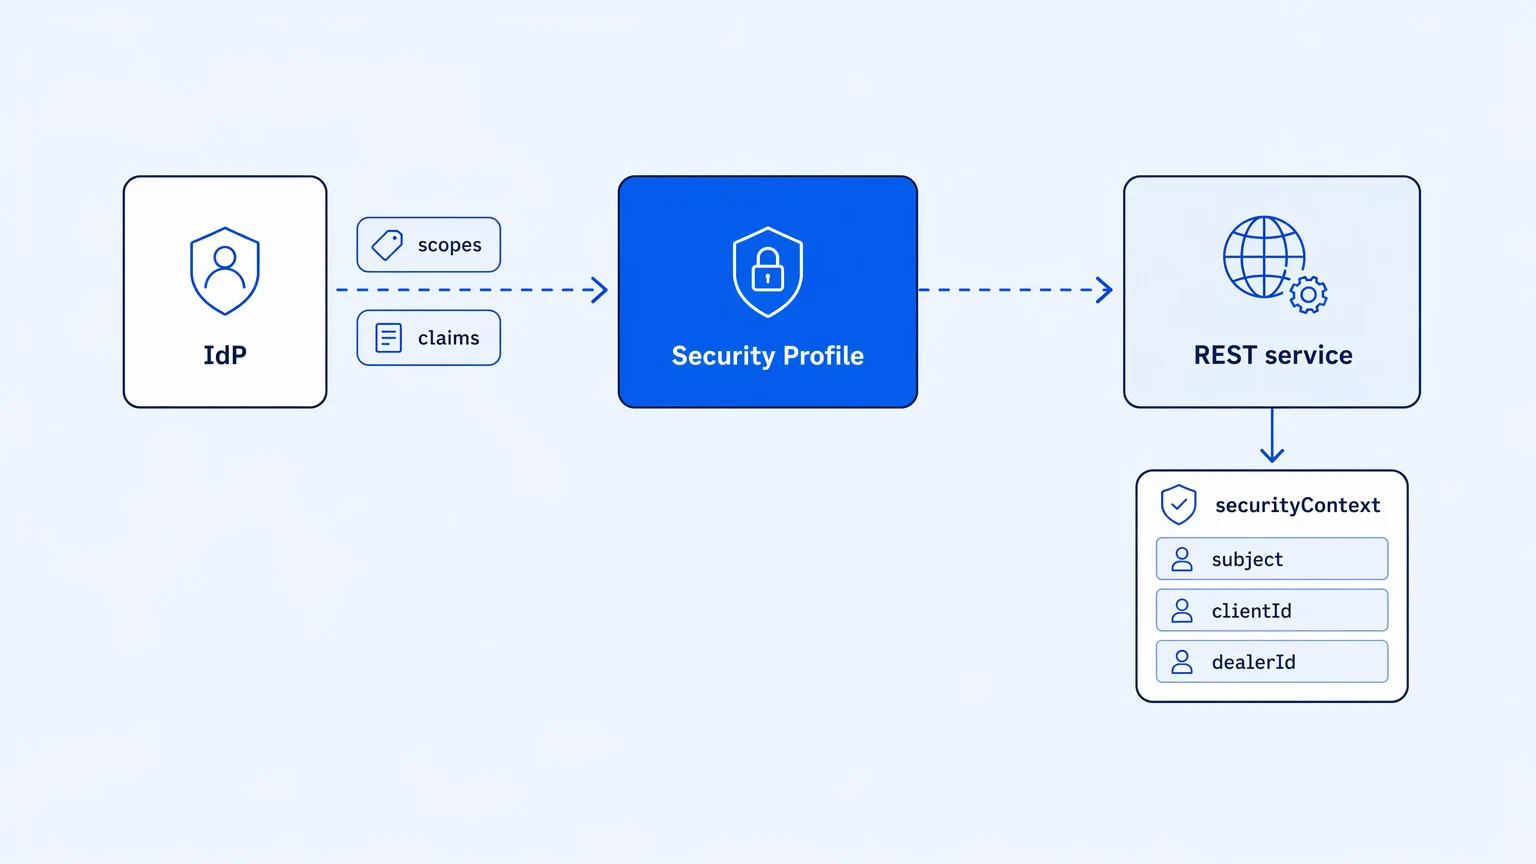
In Koodisi, the identity foundation is a Security Profile — a named config you create once in Settings → Organization → Security Profiles. It binds your OpenID Connect provider to the permission vocabulary your APIs use: the discovery URL, the audience, the access scopes your APIs recognize, and the claims your IdP issues (a dealerId, a region, a tenantId — whatever your downstream services use to scope data access).
Claims have types. A string claim carries one value; a string[] claim carries a set. Define them in the profile and they're available everywhere downstream — REST services, the MCP server, OAuth applications — without redeclaration. You can't grant a scope the IdP never issues because the profile's catalog is the only thing you can choose from.
The profile is the contract between your IdP and everything downstream.
Attach this profile to a REST service and Koodisi injects a securityContext object into the activity's output schema: subject, clientId, scopes, expiresAt, and your profile's claims. From there you bind individual claim values to request fields using the Claim Mappings dialog — right-click the target schema node, pick the claim and operator, save. The caller's verified identity lands at that specific node. It can't drift from what the IdP actually issues because the profile defines the only things that can be bound.
Most governance stories skip this binding step. The profile defines the vocabulary; the binding is how verified identity actually reaches the downstream API call.
From REST service to callable tool
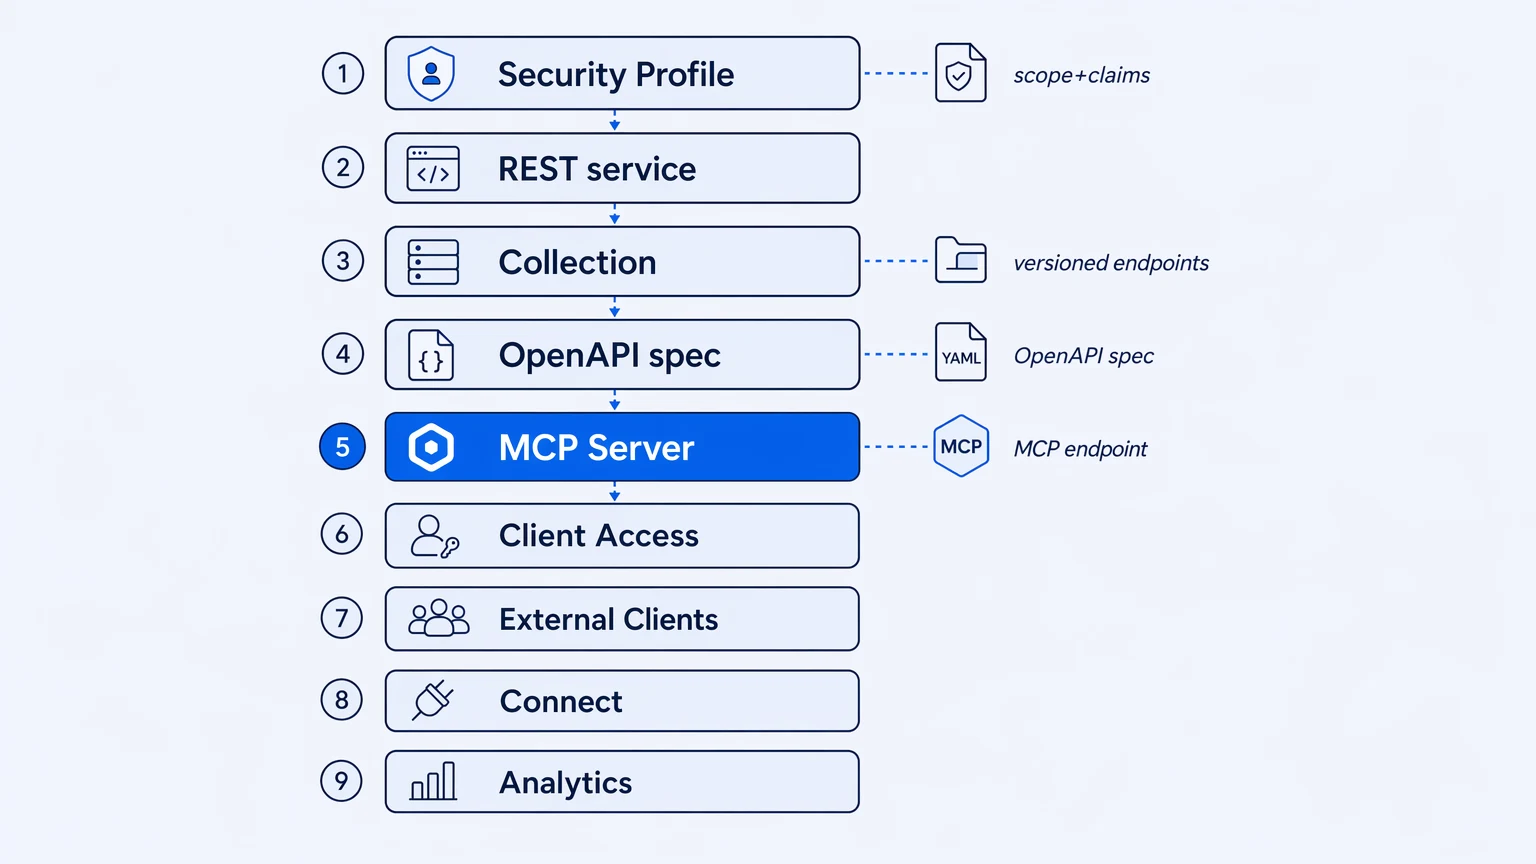
Once the REST service is scope-and-claim-gated, you build the artifact chain that turns it into an MCP tool.
Publish your workflows as a Collection in API Manager → API Collections — a versioned bundle of REST endpoints. Name it, select the endpoints, publish. That records who did it and when, and makes the collection eligible for the next step.
From that published collection, generate an OpenAPI spec. The spec is what the MCP server reads to discover operations; each operation becomes one tool. The spec is the handoff artifact between your integration layer and the agent-facing surface.
Create the MCP server in API Manager → MCP Servers, select the Security Profile, pick an environment. From that point everything on the server — which scopes tools require, which claims they check, which OAuth applications can connect — is anchored to that profile.
On the APIs & Tools tab, select the published specs and choose which operations to expose. Set spec-level defaults that every tool inherits, then per-tool overrides for anything that needs tighter access. Assign a Risk Class to each tool: Read or Write. That label travels with every invocation so a host application can put a confirmation gate in front of writes without the platform needing to understand your API's semantics.
Tools expose what was in the spec when you selected it. Editing the underlying workflow later doesn't silently change what agents are already calling.
If your tools need to call downstream APIs with their own auth — an API key, a bearer token, basic auth — configure those on Downstream Credentials, encrypted at rest, never displayed after saving. That's a separate credential plane from the OAuth credentials clients use to reach your MCP server. Clients never see the downstream keys.
Two client onboarding models, kept separate on purpose
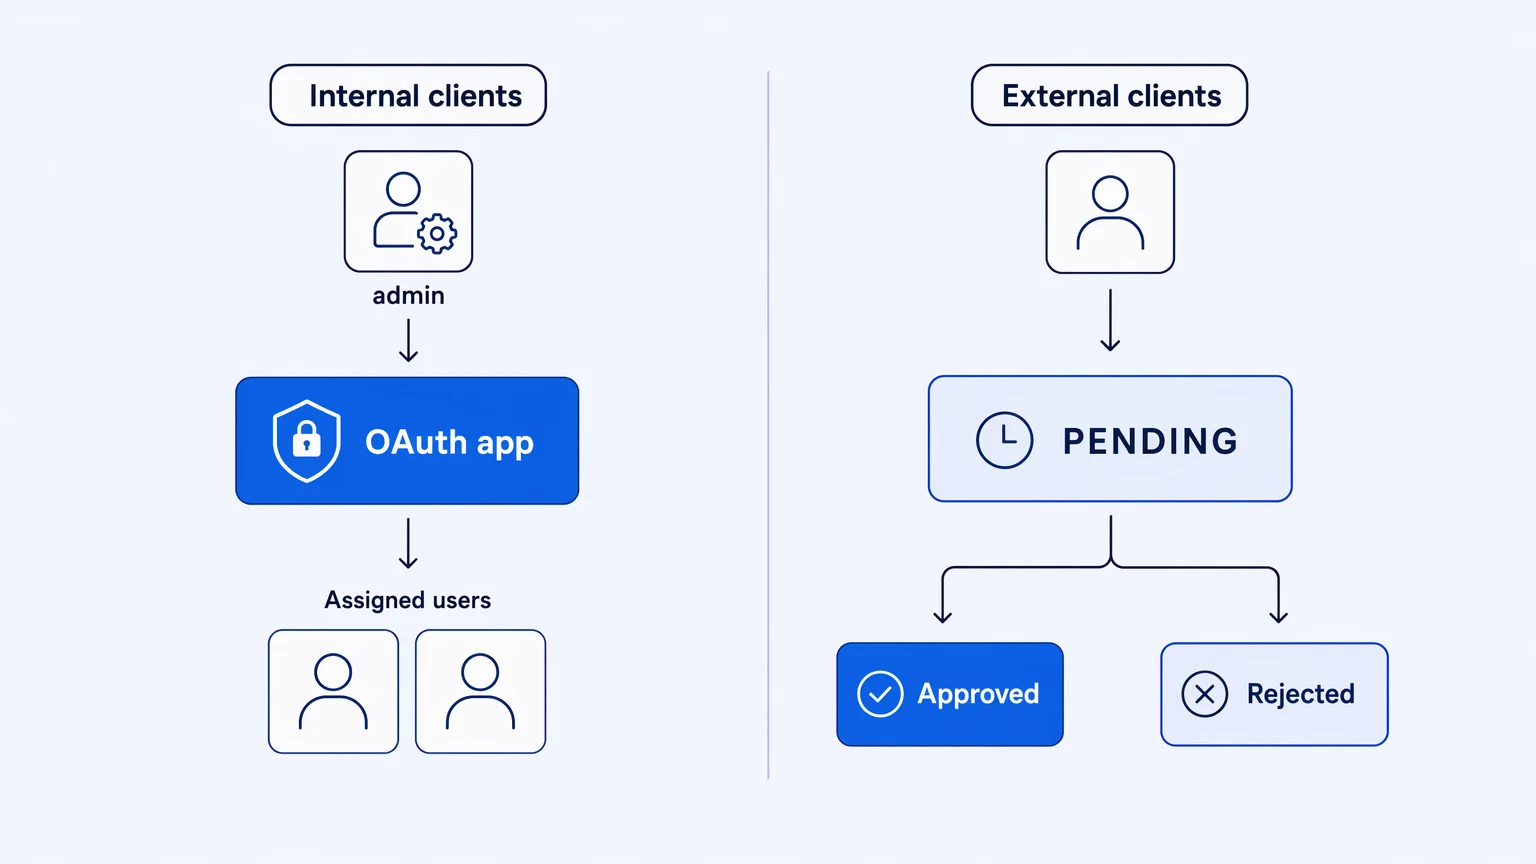
There's a reason internal and external client access are on different tabs.
Internal clients get onboarded through Client Access. Create an OAuth application, assign the scopes it grants, set default claim values, add the specific org users who can connect. The application mints a client_id and client_secret; the secret is shown once. To onboard someone: add them to Assigned Users, hand them the credentials. Only assigned users can connect, each bound to the app's scopes and claim values.
External clients go through External Clients. Enable Accept external clients on an OAuth app and you get a registration link to share outside your org. External users open it, enter their email, submit a form. That lands in a PENDING queue you review — approve or reject each one. Approved users authenticate with the app's shared credentials; their identity is their email, tied by the approval record to specific scopes and per-user claim overrides. No per-person credential is issued.
The difference is assignment versus approval. Internal users are known identities you explicitly admit; external users are unknown until they register and you gate on review. Both models enforce the profile's constraints. Both are auditable.
The client secret is shown once, at creation. Rotate, don't retrieve.
Connect and verify before you ship
The Connect tab generates ready-to-paste client configs for Claude, Cursor, Gemini CLI, mcp-remote, Python, and cURL. Pick the client type and OAuth application, copy the snippet, drop in your credentials, restart, approve the sign-in.
Before wiring up a real client: use Generate Test Token to mint a short-lived token and hit the server from Postman or cURL. It's the fastest way to confirm the governance model is working before a person is in the loop.
Every invocation is a traceable event
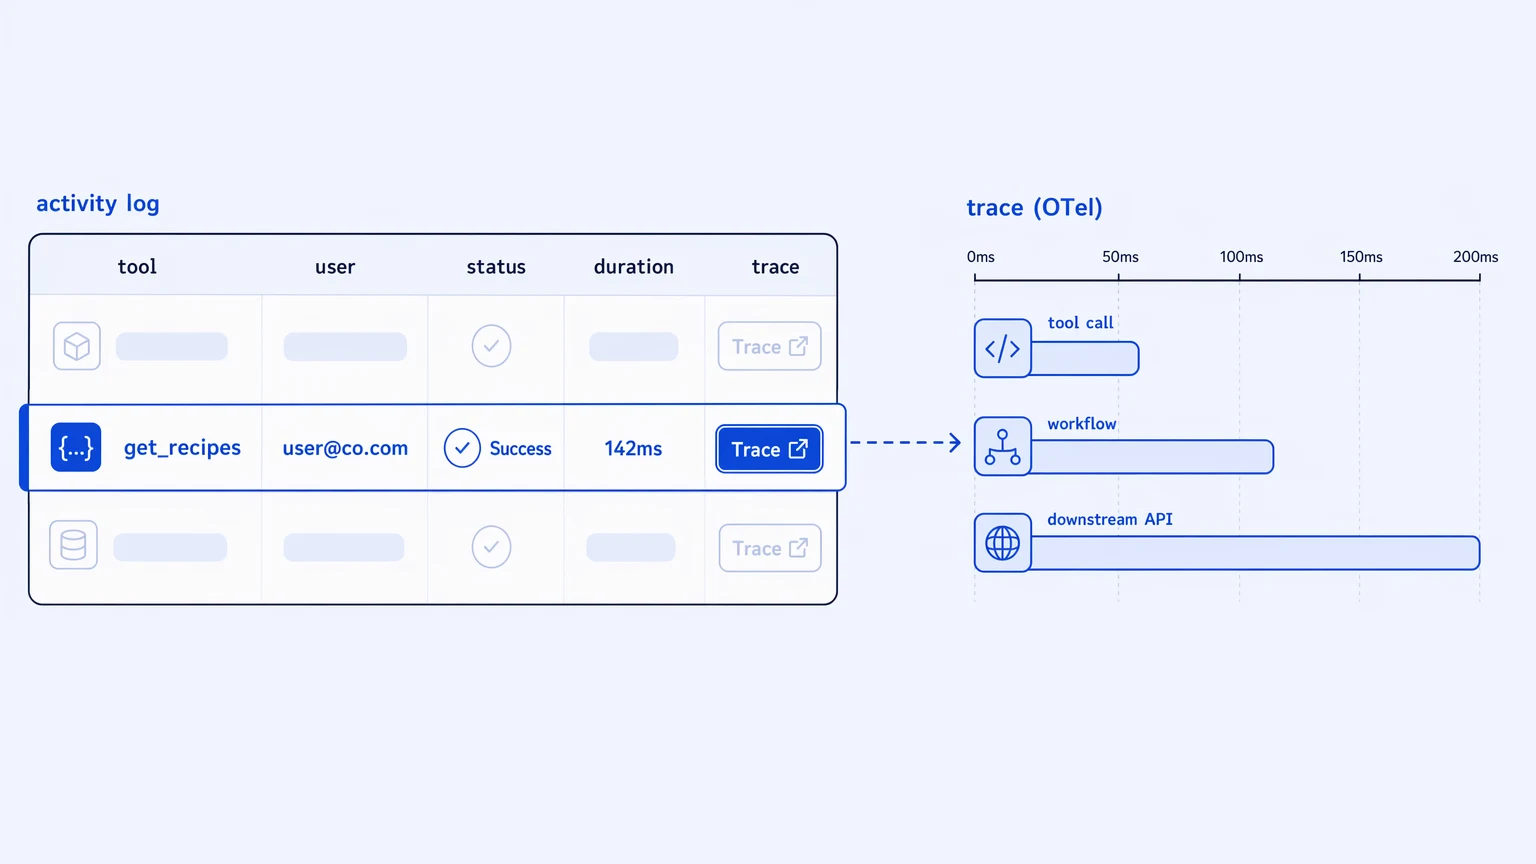
Every tool call emits an OpenTelemetry trace. The Analytics tab surfaces total calls, success rate, error count, blocked count, and p95 latency for whatever time range you need. The By Tool and By User breakdowns show which tools are getting volume and who's calling them.
The activity log is where you actually debug. Each row: tool name, caller email, OAuth application, HTTP status of the downstream call, end-to-end latency, error body if something failed. The Trace link opens the full downstream workflow trace in the Metrics & Traces page. Development servers get 7 days of lookback; Production gets 90.
This isn't a dashboard you check on a schedule. It's what lets you answer the questions agents eventually produce: which call failed, who triggered it, whether it was blocked by scope or approval policy, how long the downstream request took. Per-invocation traces with a link to the downstream span are table stakes once agents start generating traffic at volumes human workflows never did.
No per-execution billing here. Your bill doesn't move when MCP traffic spikes; only capability adoption changes what you pay.
A few things this doesn't cover
The Prompts tab — reusable parameterized instruction templates clients invoke by name — is worth a separate read once the server is up. Multi-tenancy (namespacing tool calls and credentials across tenant boundaries) is Enterprise-tier and its own topic.
If you're exposing integrations that touch regulated customer data, the architecture above is what makes it defensible: profile-centric identity, explicit claim binding, per-client scope enforcement, approval-gated external access, OTel on every invocation. Not a compliance checkbox — a set of auditable decisions you can point to when the incident review happens.
The Security Profile is where to start. Everything else derives from it.