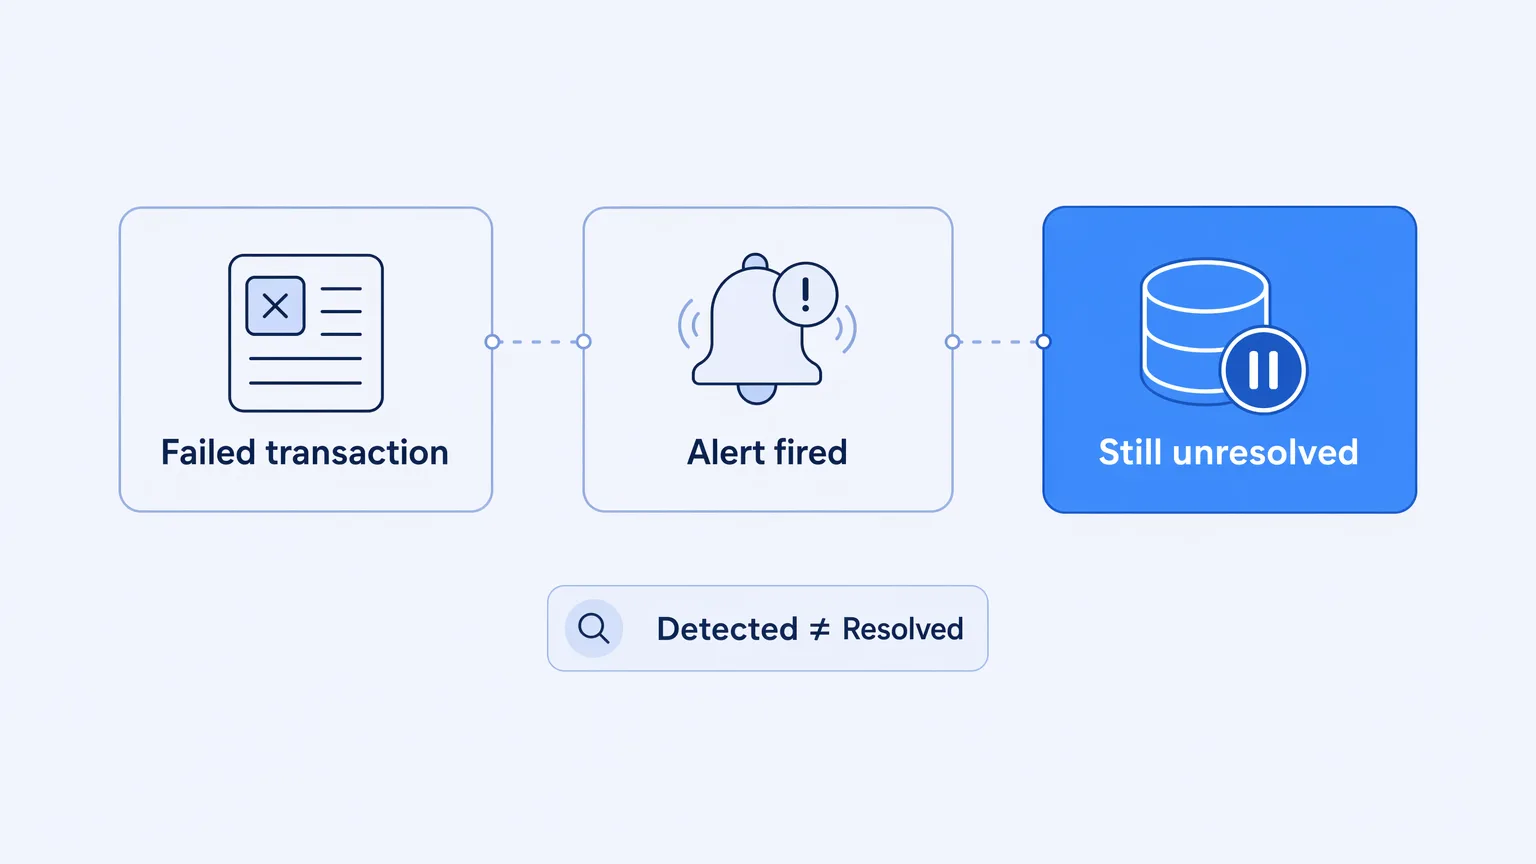
A payment sync fails at 2 a.m. The dashboard lights up red. The trace shows exactly where it broke: a validation error on record 4,412 of a 10,000-record batch. Everyone can see the problem with perfect clarity.
Nobody can do anything about it until an engineer wakes up, opens the integration, finds the record, decides whether to fix the source data or patch the mapping, and reruns something, usually more than the one record that actually failed.
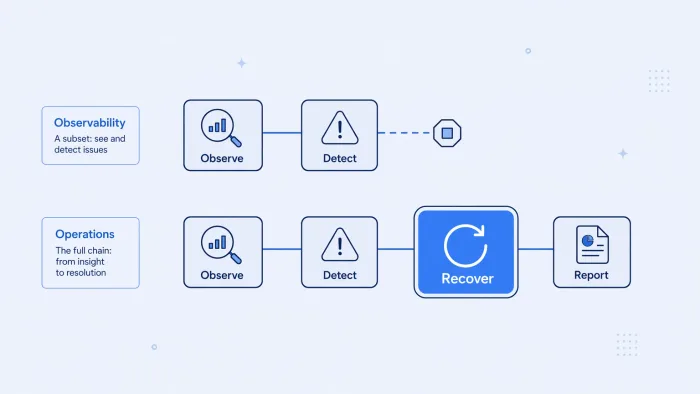
Observability found the failure. It didn't recover from it. That gap between seeing a problem and resolving it is where most integration tooling stops. It's the gap Koodisi Engage is built to close.
Monitoring answers "what broke." It doesn't answer "now what."
Every serious integration platform today ships dashboards, alerts, and traces. Watch a demo from any vendor in the category and the pitch is the same: real-time visibility, execution history, drill-down into a failed run. That's been table stakes for years, not a differentiator.
What's missing is the second half of the job. Detecting a fallout is not the same as resolving it. A platform that stops at "here's the error" still hands the actual work back to a human every time: deciding if the failure is retryable, finding the affected records, running the fix, confirming it worked. It does this whether the failure is a five-second network blip or a genuine schema break.
For a Head of Engineering running integrations across a growing stack of APIs, files, and internal services, that handback is the real cost center. Not the outage itself. The standing tax of routing every failure through an engineer's queue, regardless of how routine it turns out to be.
Visibility tells you where the fire is. It doesn't put it out.
Recovery is a distinct capability from observability — and most platforms don't build it
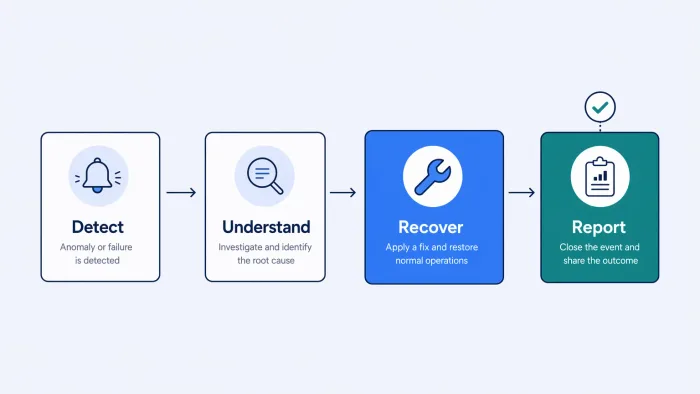
Engage is Koodisi's integration operations layer: the part of the platform responsible for detecting issues, understanding failures, recovering affected transactions, and reporting outcomes. It covers integrations built in Koodisi and, just as often, transactions originating from other integration platforms or custom services feeding the same operational picture.
It's organized into six pillars, worth naming because each does a different job:
| Pillar | What it does |
|---|---|
| Observe | Real-time transaction monitoring, execution history, drill-down |
| Detect | Automated fallout detection, anomaly identification, alerts, escalation |
| Understand | Error classification, business-readable translation, affected-record context |
| Recover | Automatic and manual retries, retry policies, record-level recovery, guided resolution |
| Govern | Tenant isolation, permissions, environment-aware configuration, credential management |
| Report | Transaction reporting, failure trends, resolution status, technical and business views |
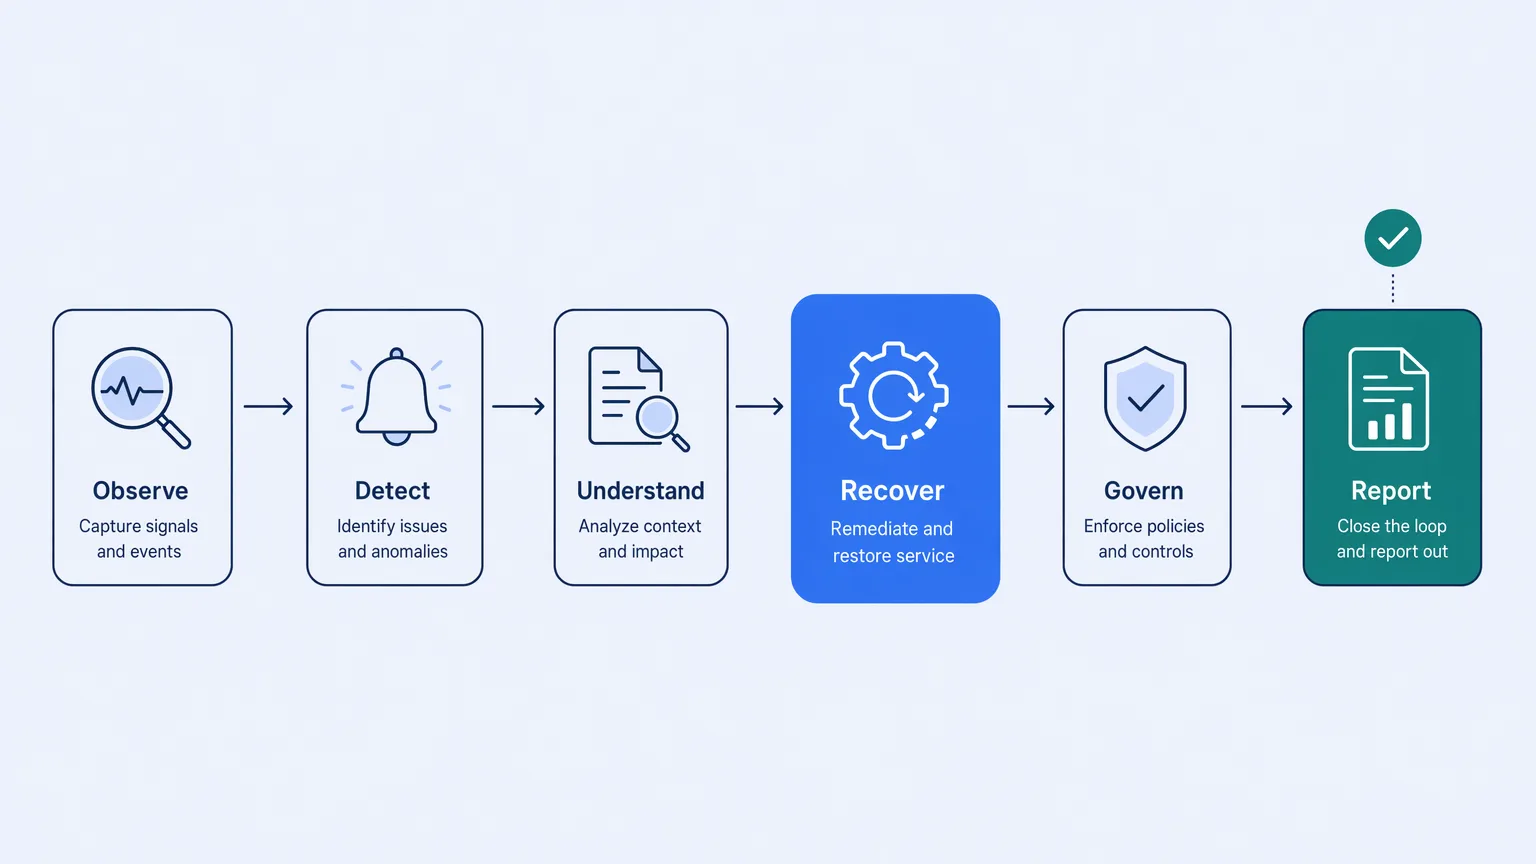
Look at where competitor content in this category clusters: heavily on Observe and Detect, lightly on Understand, and thinly on Recover as a first-class, configurable capability rather than a manual afterthought. Retry logic exists in most platforms. Treating recovery as its own operational discipline, with policy, classification, and record-level precision, is rarer.
The pillar that actually changes an engineering team's day-to-day is Recover, because it's the only one that removes work instead of just reporting it.
The lifecycle a failure should go through — and usually doesn't
Walk a fallout through a platform that only observes: detect, alert, page an engineer, engineer investigates, engineer manually reruns something, engineer hopes it worked, nobody reports on it afterward unless someone asks.
Walk the same fallout through an operations layer, and it looks different. Detect. Classify the error (authentication, validation, connectivity, rate limit, mapping, destination-system). Translate it into something a support engineer, not just the person who wrote the integration, can act on. Apply a retry policy that already knows whether this error class is worth retrying automatically. Retry at the record level if it is. Escalate with full context if it isn't. Land in a report that shows resolution status alongside the failure trend.
The difference isn't cosmetic. One version ends with an engineer doing forensic work at 2 a.m. The other ends with a policy doing the routine part and a human doing only the part that needs judgment.
A recovery layer's job is to shrink the set of failures that require a person to look at them at all.
Why "record-level" is the detail that matters most
The most common failure mode in integration operations isn't a broken integration. It's a broken record inside a working integration: one malformed field, one duplicate key, one downstream rate limit hit at the wrong moment, buried inside an otherwise-successful batch of thousands.
Platforms without record-level recovery handle this the same way regardless of scale: rerun the whole job. That's expensive when the batch is large, risky when the successful records in that batch aren't safely re-processable, and wasteful when the fix is obvious and the rest of the run was fine.
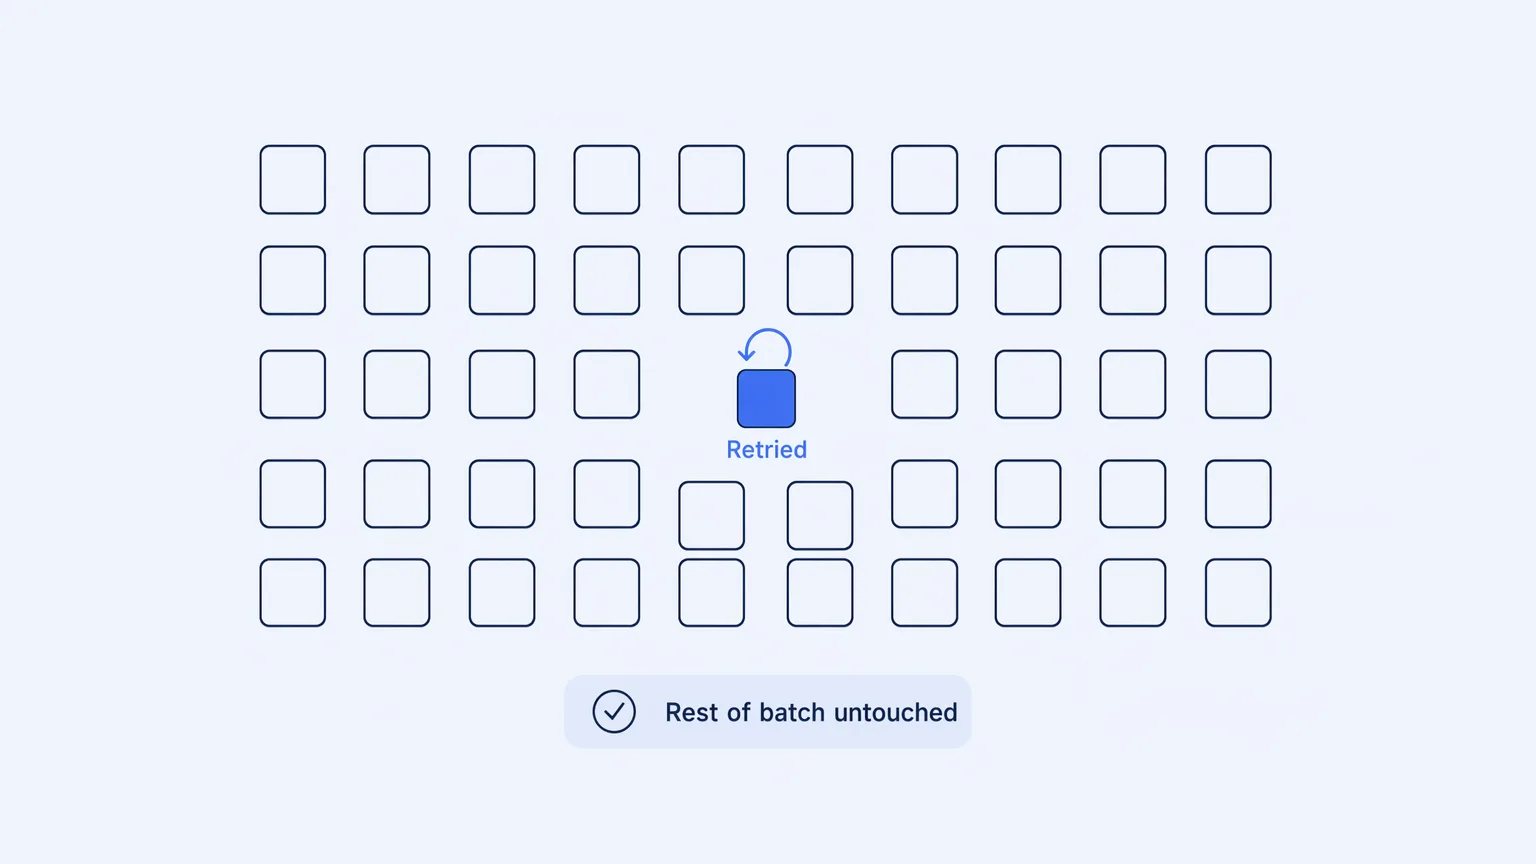
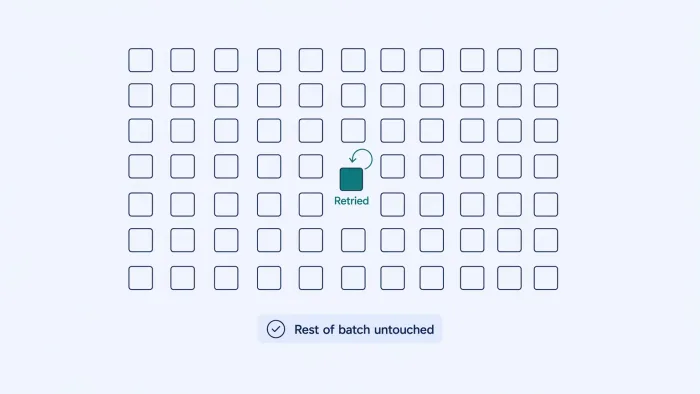
Record-level recovery treats the failed row as the unit of work, not the run. Correct the source data or the mapping, retry the specific record, leave the other 9,999 alone.
A distinction that sounds small in a slide deck is the difference between a two-minute fix and a full reprocessing window, every time a single row misbehaves.
Where the human still belongs
None of this replaces judgment. A genuinely new failure mode — a destination system that changed its contract, a data quality issue upstream that needs a source-side fix — still needs an engineer to look at it. Automatic recovery is scoped to failures a policy can classify with confidence; guided resolution exists precisely because some failures need a human decision, just a well-informed one instead of a blind one.
The honest claim isn't "no more manual work." It's fewer categories of failure that require it, and better context for the ones that still do.
Building the operations layer, not just the log viewer
Koodisi already ships OpenTelemetry metrics, traces, and logs from the Community tier, and delivery failures carry full payload context with one-click replay. Engage is built on top of that observability foundation. It's the piece that turns a trace into a resolvable action instead of a well-lit dead end.
That's also why Engage treats tenants and environments as a first-class concern rather than an add-on: teams running integrations for multiple clients or business units need failure classification and retry policy that respect isolation between them, plus configuration that differs cleanly between development, staging, and production.
This post opens a series on what that operations layer looks like in practice: what happens after a failure, the difference between automatic and blind retries, why support teams shouldn't need a developer for every resolution, and why record-level recovery is the detail the rest of the industry treats as an edge case instead of the default. Koodisi's pricing model runs on the same logic that shapes Engage: no per-execution billing, no overage invoices. The cost structure doesn't move just because your operational load does.
If your team routes every integration failure through an engineer regardless of how routine it is, that's the gap Engage closes. Start on the Community tier and see what it looks like against your own integrations.