Most mid-market engineering teams cannot answer a basic question about their integration stack: did the workflow that ran yesterday do the right thing. They can answer whether it ran. The two are not the same, and the gap between them is where reconciliation work, on-call fire drills, and surprise invoices live.
The reason isn't carelessness. It's that integration tools, as a category, weren't built to be observed. Their dashboards light up green when the tool ran. They stay green when the workflow finished without doing the work. That's the lie sitting underneath every "integrations are green" status update.
"Working" usually means "nobody is looking"
A typical mid-market integration stack is four products in a trench coat: a usage-priced automation tool for the easy stuff (somebody in ops set it up), a self-hosted workflow runner for the harder stuff (a senior engineer built it during a hackweek), a few cloud functions for the things neither of those handles, and one or two enterprise iPaaS connections holding the seams together.
When the platform lead says "integrations are green," what they mean, in practice, is some subset of:
- The automation tool's UI shows no errors on the last hundred runs
- The workflow container responds to a process check
- The cloud-function alarm hasn't fired
- The iPaaS recipe is marked active
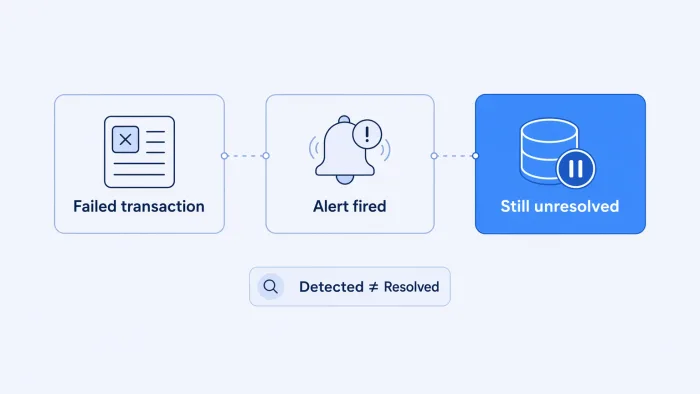
None of those tell you the workflow did the right thing. They tell you the workflow ran. That's the gap the expensive lie lives in.
In a normal week, stacks like this will: silently retry until a sibling record gets overwritten; fan one trigger into thousands of executions because of a bad loop; emit a 200 from a webhook that ate the payload; succeed on the orchestration side and fail silently on the third-party API; finish a run that never wrote the most important field. The dashboards stay green. Nobody is lying. Nobody can see.
Why none of the standard tools fix this
Engineering teams are not bad at observability. They run real APM. They have OpenTelemetry on their backend services. The integration layer is dark because the tools, as a category, weren't built to be observed.
The pattern across the category is the same shape, with small variations:
- UI-only task logs. Every task is a row in a table. There's no trace, no parent-child relationship across the chain, no way to ask "show me every workflow whose run took longer than 8 seconds last Tuesday." There's no programmatic export of structured spans.
- Execution logs in a database. You can
tailthem. There's no distributed trace context, no native OpenTelemetry exporter on free or starter tiers, and the docs themselves tend to point you at "stream logs to your own observability stack" — meaning you build the bridge, and most teams never get around to it. - Real observability gated behind enterprise contracts. Streaming to a real backend is often available, but only on the top SKU. Below that, you get screenshots.
- A flat managed-runtime layer where the business owner of the workflow has no idea their observability surface even exists, because only the platform engineers know how to query it.
The common pattern is that integration tools log; they don't trace. Logs answer "did the activity happen?" Traces answer "what happened to this customer's request?" You can run an enterprise on the second question. You cannot run one on the first.
So the hidden cost isn't that you're missing a dashboard. It's that the dashboards you have are answering the wrong question.
What it actually costs
The bill is bigger than it looks because it shows up in five places that never land in the same meeting.
There's the reconciliation tax. Every closing cycle, finance and ops re-run the data themselves. CSV out of the CRM, CSV out of the ERP, an Excel VLOOKUP, three threads on the messaging tool. Reconciliation exists at most mid-market companies because nobody trusts the integration to have done it right. A 200-person company can burn 20–40 person-days a quarter on this. That cost doesn't appear on any vendor invoice.
There's the on-call drag. When something does page, the integration layer is the worst place to triage from. There's no trace to follow, so the engineer reverse-engineers the failure from logs scattered across four tools. The standard fix is "rerun it and see." MTTR on integration incidents in stacks like this is routinely 6–10x longer than MTTR on application incidents in the same company.
There's the engineering churn cost. Senior engineers don't want to work on integrations you can only inspect by clicking through a UI. So the work gets reassigned to the most junior person, who can't read the previous flow because there are no comments and no version history. Then the flow gets rebuilt from scratch every 18 months. Multiply by the number of integrations.
There's the bill-shock tax. Most usage-priced integration tools charge for steps run, including failed ones. A runaway loop or a misconfigured retry can fan into millions of billed executions before anyone catches it. Without observability, the first alert you get is your own AP department.
And finally there's the audit tax. When a regulator or auditor asks "what changed in this workflow on April 12, who approved it, and what was the result," the answer in most stacks is a chat screenshot and a promise. SOC 2, HIPAA, and PCI all assume you can answer that question. Most integration tools assume you cannot.
Add it up and the integration line you see on an invoice is the smallest part of the bill. Loaded with reconciliation, on-call time, engineering churn, and bill volatility, the real number for a mid-market team is often an order of magnitude bigger than the licence cost.
What observable integrations actually look like
The fix isn't another dashboard. It's treating the integration layer the way you already treat the rest of your production stack — as software, with traces, with version history, with deploy records.
In practice, that means a few things working together.
Every workflow run emits an OpenTelemetry trace. Not a log. A trace, with spans for every activity inside the workflow, parent-child correlation across the whole chain, and attribute tags you can filter on — customer ID, workflow version, environment. If your team already lives in a real observability backend, the traces land there. If they don't, the platform's own trace search works the same way. Either way, when finance asks what happened to a specific invoice, the answer is a single filter, not a war room.
That trace answers the question business owners actually ask, which is what happened to this one record. Not did the system stay up.
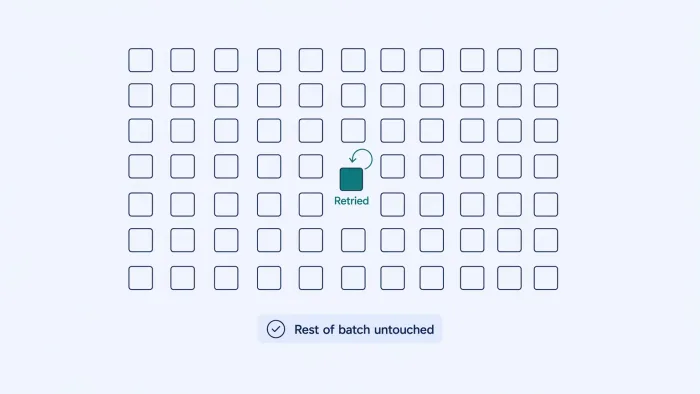
Workflows are Git-versioned. Branch, PR, merge, deploy. Every change has an author, a review, a deploy record, a rollback path. When the auditor asks "what changed and when," the answer is git log. When a junior engineer asks "why does this flow do this weird thing in line 14," the answer is the PR description from two years ago. Schemas are contracts, written in JSON Schema or OpenAPI, so a producer who breaks the contract gets caught at deploy time, not by the CFO three weeks later. Delivery failures are first-class: every failed event is captured with its full payload, attached to a dead-letter queue, replayable from the platform. Recovery is a button, not a thread that ends in someone manually re-inserting rows.
And the pricing model doesn't punish you for being observable. OpenTelemetry streaming on every tier means trace data isn't an upsell. Flat pricing means you don't audit your own metrics to avoid the bill.
This is the architecture Koodisi ships, and as far as we can tell from a 2026 read of the category, it's the only iPaaS that ships it as the default rather than an enterprise-tier upsell.
What changes for the team
The team stops finding out about integration failures from the CFO.
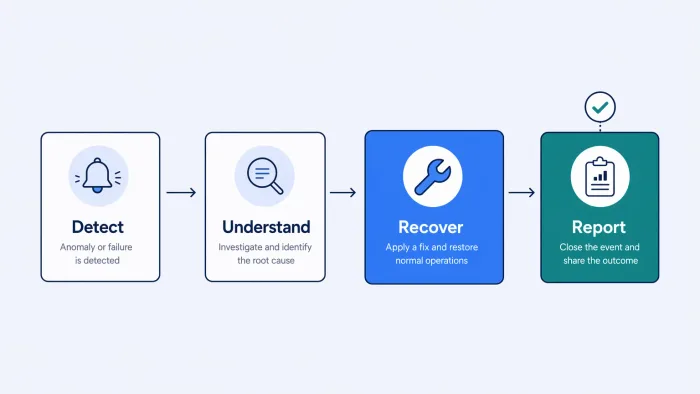
The on-call engineer opens the trace, sees the failed span, sees the payload, sees the workflow version that ran, sees the deploy that introduced the change, and rolls back. MTTR drops from hours to minutes. Reconciliation shrinks because finance can ask the platform "show me every invoice that hit the ERP this quarter and didn't make it to the CRM" and get an answer in 30 seconds, where last quarter it was a week.
Auditors get a git log plus a trace search and stop sending follow-up emails. The integration bill stops being a surprise because the team can see the execution graph and the cost shape of every workflow before they ship it, not after.
The integration layer turns back into something engineers will work on, because it looks like the rest of the stack instead of the part of the codebase nobody wants to inherit.
If you want to test your own stack
Pick the most important integration in your business — the one between the system of record and the thing that bills the customer — and try to answer three questions about a specific run from last Tuesday. Did the workflow run end-to-end, and how long did it take. What was the input payload, and what got written to the destination. Who deployed the current version, and what changed in it relative to the version before.
If you can answer all three without opening more than one tool, your stack is in better shape than most. If you can't, the gap between "integrations are green" and what the dashboards actually tell you is bigger than your license bill. That's the cost worth measuring.
Koodisi is the integration platform we built for engineering teams that have stopped pretending dashboards are enough. Workflows are Git-versioned, OpenTelemetry traces ship on every tier, and the Professional bill stays at $399/month no matter how much production traffic you push through it. The Community tier is free, ships traces from day one, and takes about ten minutes to put a real workflow on. Run something at it that you actually care about. The places it breaks are the most useful conversation we can have.
Koodisi is built by Ivoyant. koodisi.com.