You already know what iPaaS is. It's the category between Lambda scripts and a six-figure enterprise contract — the platform that connects your SaaS stack without asking your team to maintain a fleet of custom integrations. You've evaluated at least one. You may be running one now. This isn't a glossary.
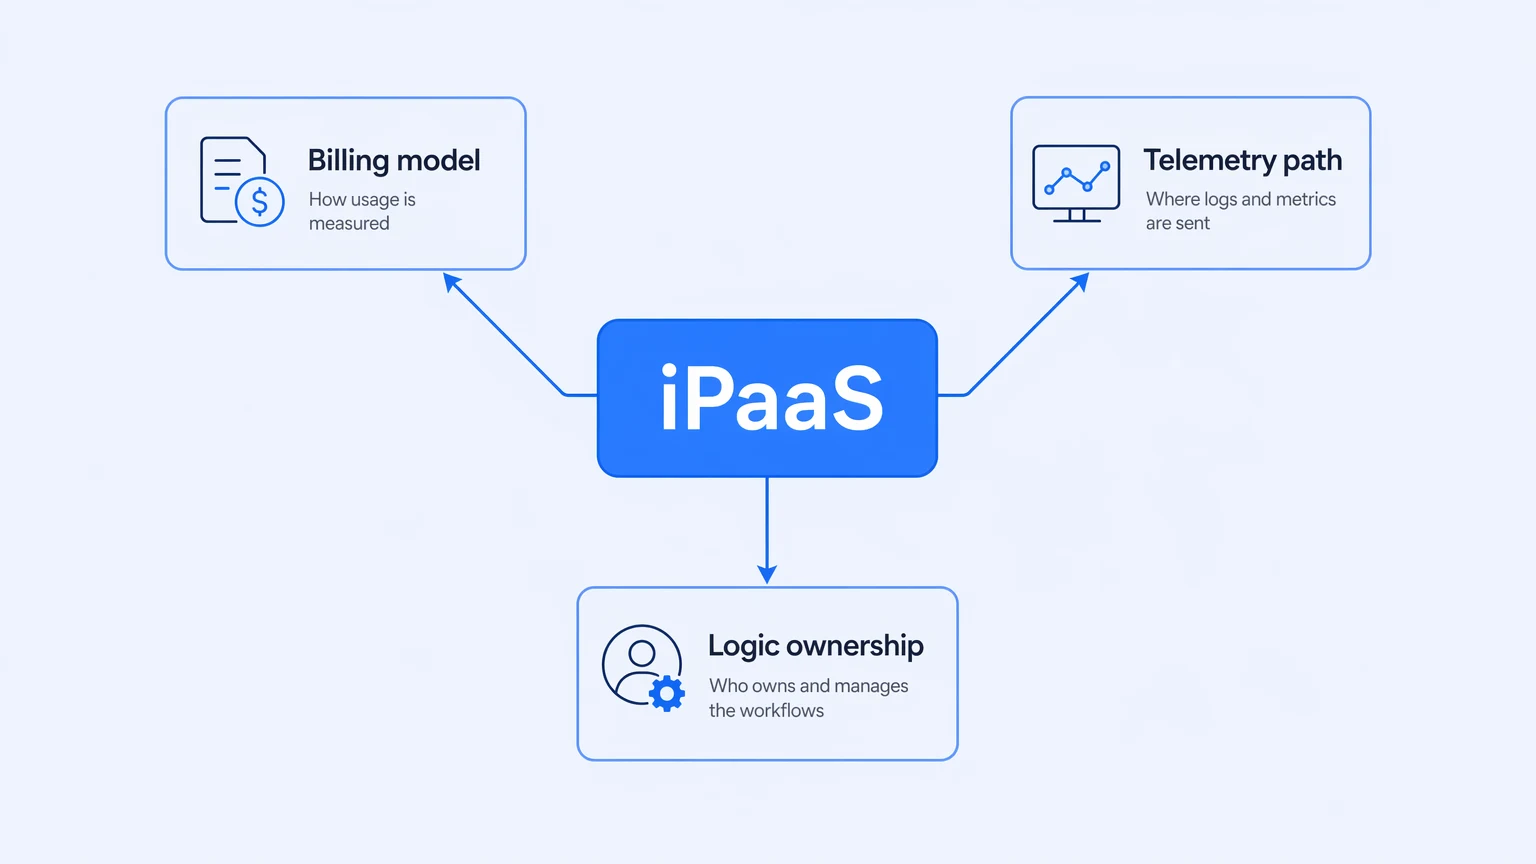
What the standard "what is iPaaS" content skips is what the platform becomes once it's in production: how the bill behaves when upstream partners misbehave, where the telemetry ends up when something breaks at 2 AM, and whether the workflows you spent a quarter building are actually yours when you want to leave. Those questions don't appear in the feature matrix. They show up on your third invoice, in your first post-incident review, and in the exit conversation you didn't plan to have.
The category description and the production reality are two different things. This is the second one.
The definition that doesn't make it into the marketing copy
iPaaS — Integration Platform as a Service — is a managed runtime that handles the infrastructure layer of system-to-system communication: message routing, transformation, error handling, retries, authentication, and delivery guarantees, without you owning the underlying compute. You define the logic; the platform executes it. That's the correct, boring definition.
The more useful framing is what iPaaS replaced. Before the category existed, that work lived in custom code: point-to-point API scripts that one engineer owned, Lambda functions nobody could read eighteen months later, vendor-specific ETL tools that locked the schema into a format only they understood. iPaaS abstracted that into a deployable workflow maintainable by more than one person.
That's the bargain: you trade some flexibility and control for someone else running the runtime. The question every purchasing decision should interrogate — and almost none do — is what "some control" means in practice. The answer varies enormously across platforms and almost never appears in the vendor's own explainer.
The category is real. The value is real. The definitions handed to you by the vendors who benefit from your choosing them are incomplete.
How the bill behaves is architecture
The most common surprise in iPaaS procurement isn't a missing connector. It's the invoice.
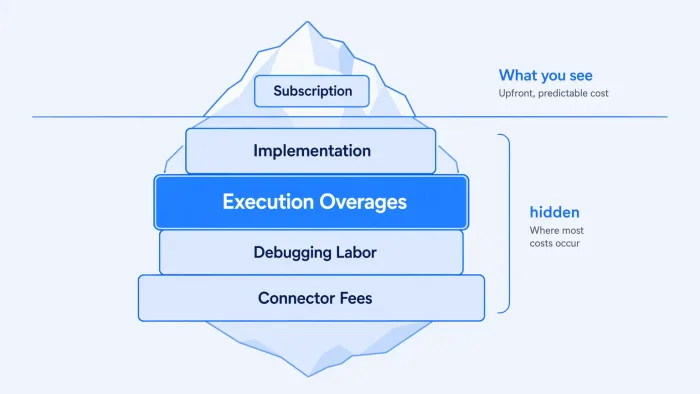
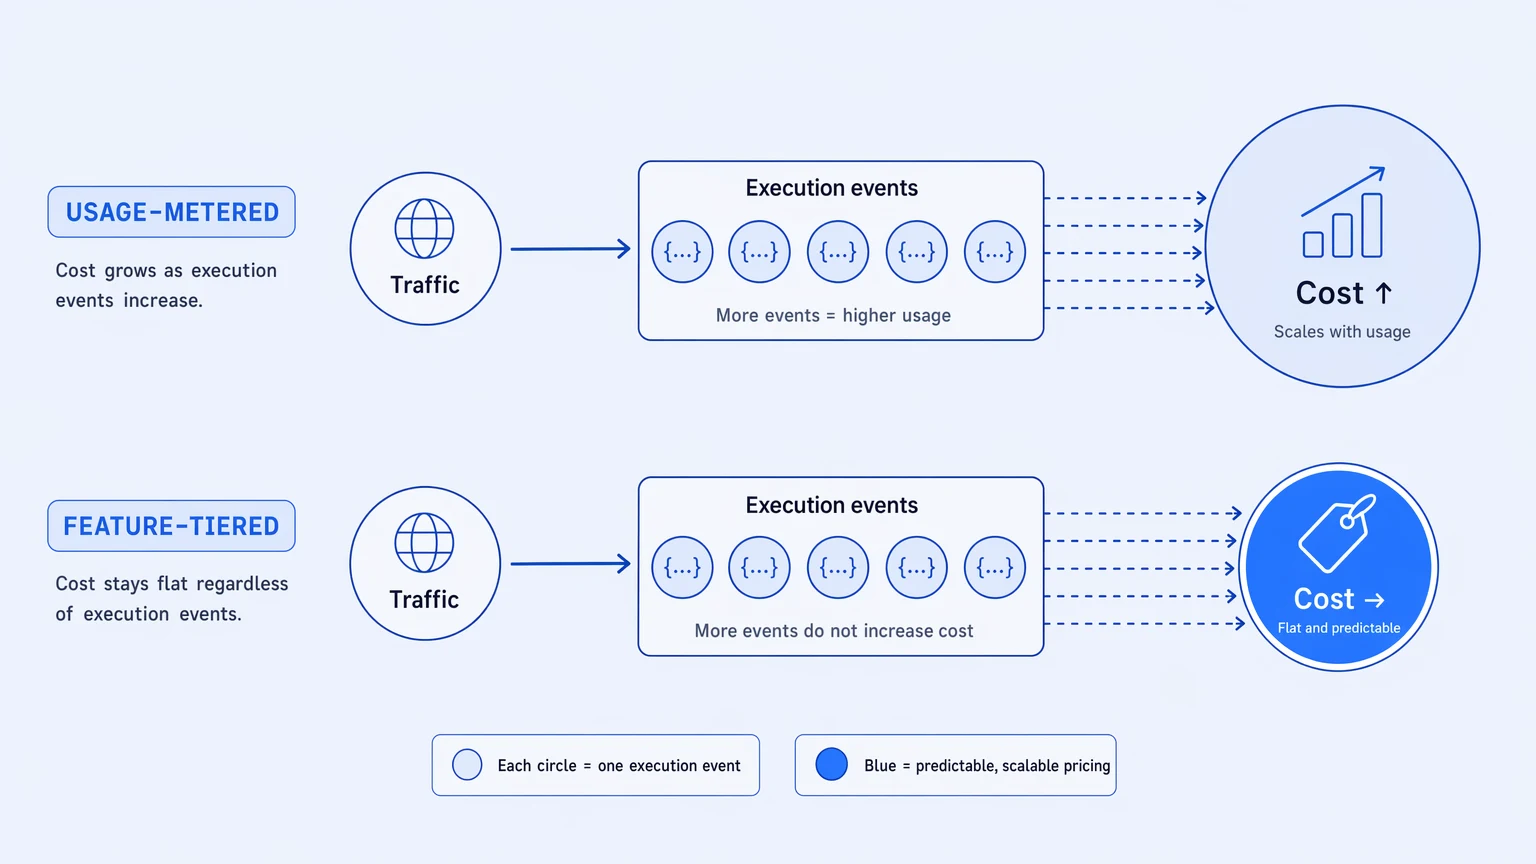
Most platforms in this category price on execution volume — tasks, operations, recipe runs, credits, whatever the unit is called this quarter. The pitch is fairness: pay for what you use. The production reality is that your cost is a function of variables you don't control. A downstream partner starts retrying. A loop fans out wider than expected. A backfill runs over a weekend. The meter runs. Finance asks why.
The mechanics are worse than the headline. On usage-metered platforms, retries typically count. Loop iterations count. Steps that completed before a workflow failed midway can still bill — you paid for execution that produced nothing. The unit you're charged for has almost nothing to do with business value and a lot to do with how chaotic your upstream is on any given day.
This isn't a billing quirk. It's an architectural property. A per-execution pricing model couples your cost to your traffic, and traffic is the variable you control least when your integrations matter most. A retry storm from a payment processor, a partner system update pushing webhook volume overnight, a backfill someone kicked off on Friday — each one runs up the meter at the exact moment your team is already dealing with something else.
The pricing model is part of the platform architecture; evaluating them separately is where procurement goes wrong.
The alternative — feature-tiered pricing, where the bill scales with capability adoption rather than execution volume — exists. On a platform built that way, you watch traffic spike in your telemetry without it propagating to your invoice. You run retries and replays without billing anxiety. Don't take that at face value from a vendor; ask for the billing definition in writing — which events count toward the meter, which don't, what happens when the limit is hit. A platform with no per-execution billing and no overage invoices will answer plainly.
Observability is not a feature. It's where debugging lives.
When something breaks in an integration — and it will — the question that determines how long it takes you to fix it is: where do I look?
On most platforms, the answer is: in the platform. You get a UI with recent runs, error messages, a log viewer if you're lucky. That's fine when the integration platform is the only system you're troubleshooting. It's a problem when integration failures are one category of incident among several, and your team's institutional debugging knowledge lives in Datadog, Honeycomb, Grafana, or wherever your application observability already sits.
The fragmentation is subtle but real. Application traces live in one place. Infrastructure metrics in another. Integration failures in a third — a platform-specific UI that nobody monitors proactively because it's a second screen. Mean-time-to-detect climbs not because the monitoring doesn't exist, but because it exists in a silo nobody watches until someone downstream complains.
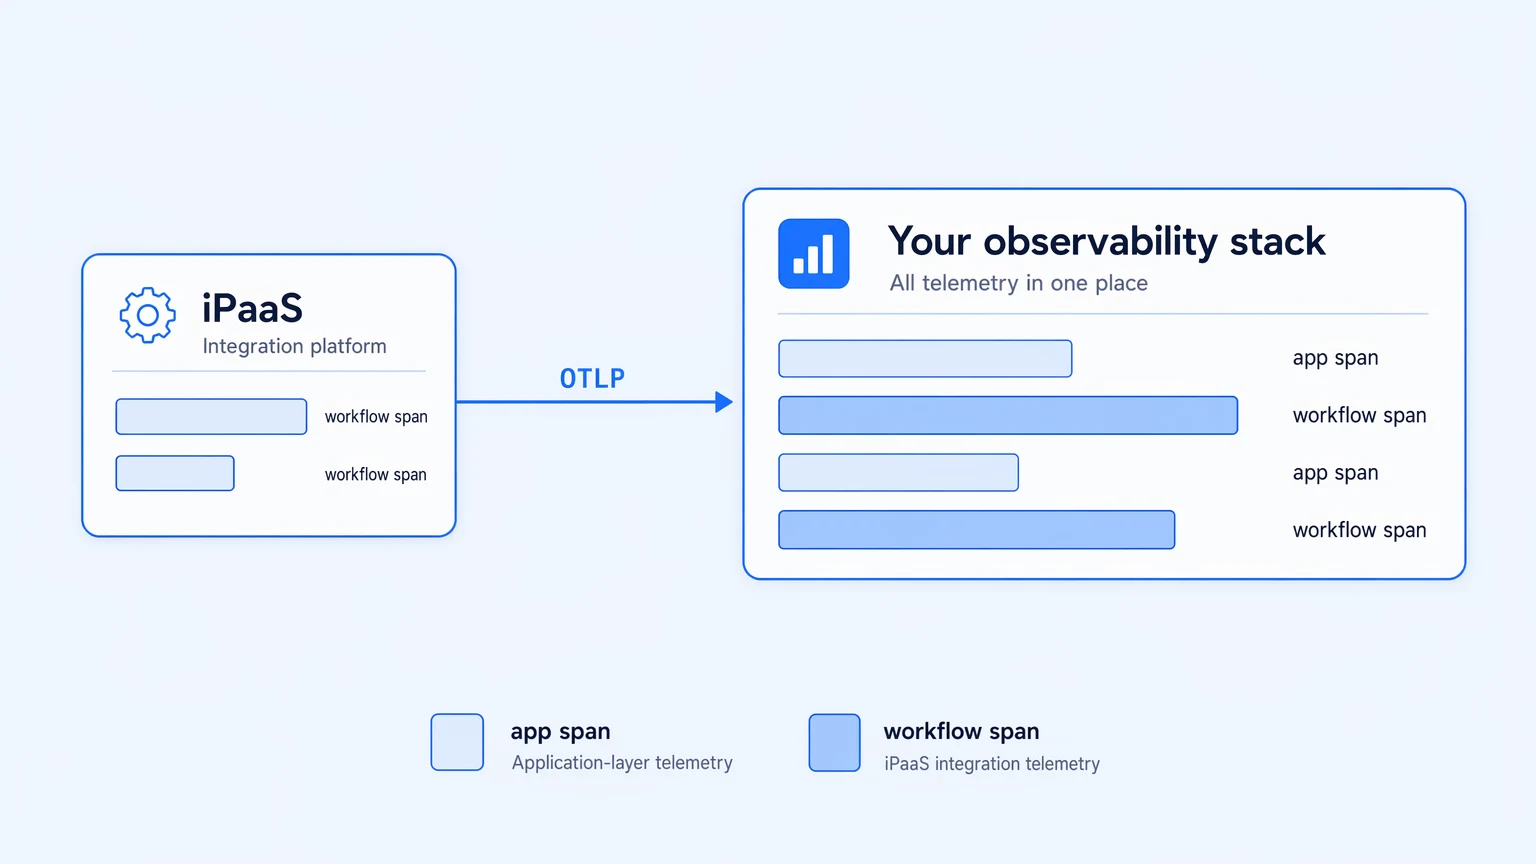
OpenTelemetry closes this. An iPaaS that emits traces, metrics, and logs in OTLP format lets integration spans land next to application spans in whatever stack you already run. A failed workflow run becomes a span in the same waterfall you're already reading. Root cause moves from grepping a proprietary log UI to filtering by tag in your existing dashboard.
The evaluation question is specific: does the platform emit native OTLP, and on every tier? Some platforms gate observability to enterprise contracts, or hand you a docs page on "how to build the pipeline yourself." Native OTel from the free tier is not universal — worth confirming before you're debugging something at 3 AM.
Integration failures that live in a different monitoring silo than your application failures take twice as long to diagnose.
The logic ownership question most teams skip
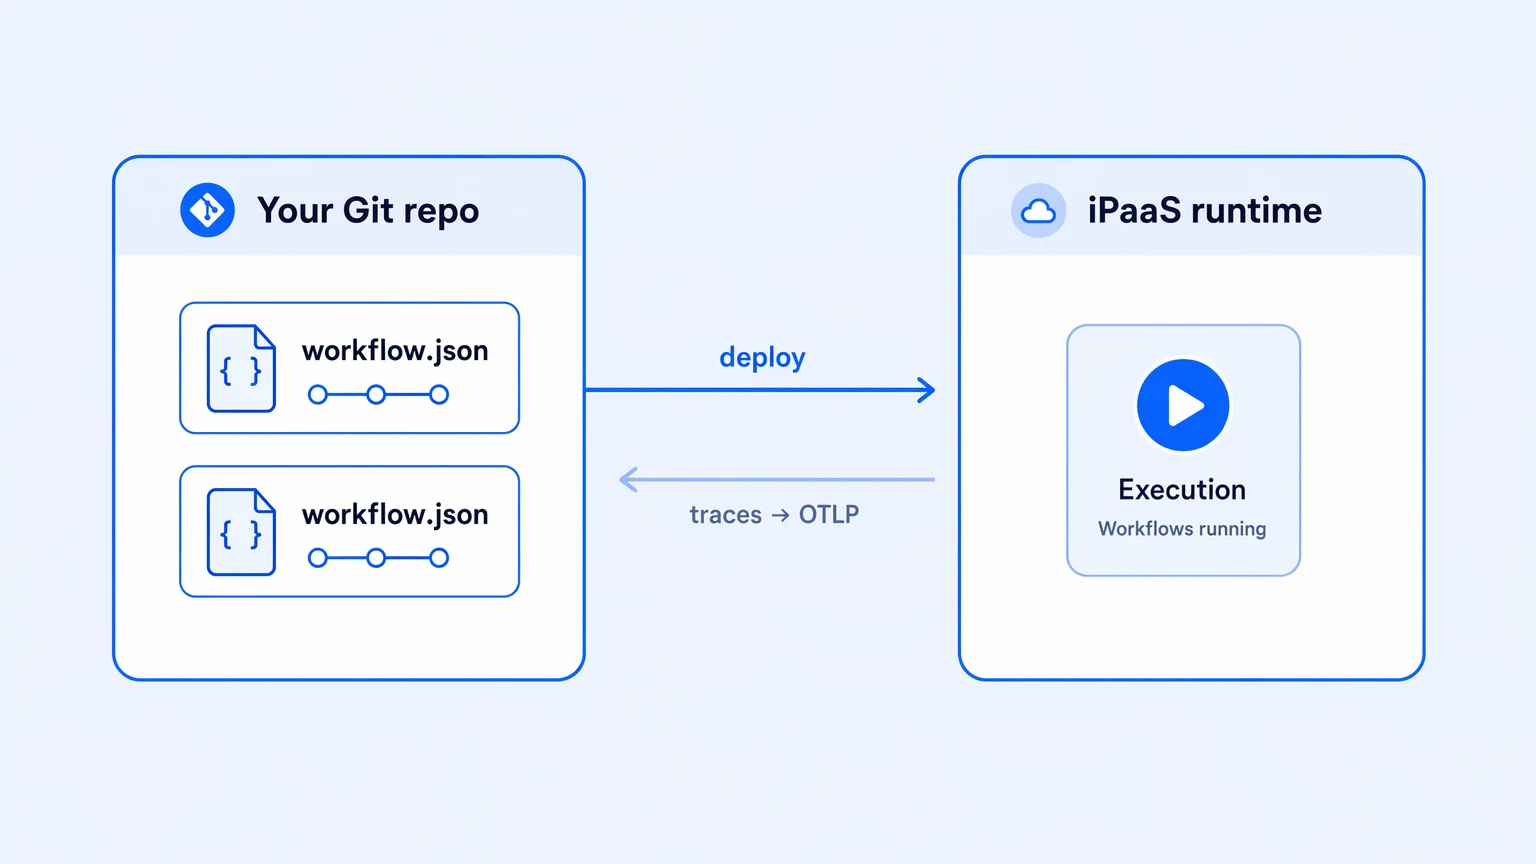
There's a third production surprise that doesn't show up until later: the exit conversation.
Most iPaaS platforms store workflows in a proprietary format — a visual recipe, a JSON graph, a drag-and-drop canvas on their servers. You can read it in their UI. You cannot easily take it anywhere else. When you outgrow the platform, hit a pricing change, or want to move, reconstructing that logic is your team's problem. The platform kept the runtime. You kept the bill.
Real Git integration changes this. When workflows are versioned as files in your own GitHub or GitLab repository — not exported for backup, but actually version-controlled with branches, tags, and commit history — the logic is yours in the same sense your application code is yours. You can review changes through your normal PR flow. You can roll back to a commit. You can read the full history of who changed what and when without filing a support ticket.
The distinction between "we integrate with Git" and "your workflows are real Git files" matters. The first can mean backup exports to a bucket with a timestamp. The second means the platform's source of truth is your repo; the platform is the runtime, not the record. Ask which one you're getting. And ask whether the platform's own documentation recommends against in-platform merges — that single question surfaces how much of the Git story is real versus marketed.
Workflow logic that lives only in the vendor's format is a liability that doesn't appear on any feature matrix.
What this means for evaluation
The standard iPaaS evaluation — connector counts, a SOC 2 badge, a row for "version control: ✓" — measures things that are easy to demo and cheap to claim. It rarely measures the things that predict production pain.
Three specific questions do: how does the bill behave when retries run? Which tier does native OTel ship on? Are workflows real Git files or exported backups? Those answers are slightly awkward to extract from a sales cycle, and enormously predictive of what working with the platform looks like at month six.
Koodisi was built around these three production constraints: no per-execution billing, no overage invoices, native OpenTelemetry from the Community tier, and Git-Enabled apps where workflows are real files in your repo. If you want to test that against something you already run, the Community tier is free — no credit card. The constraints that matter in production are the ones worth verifying in a trial, not a demo.