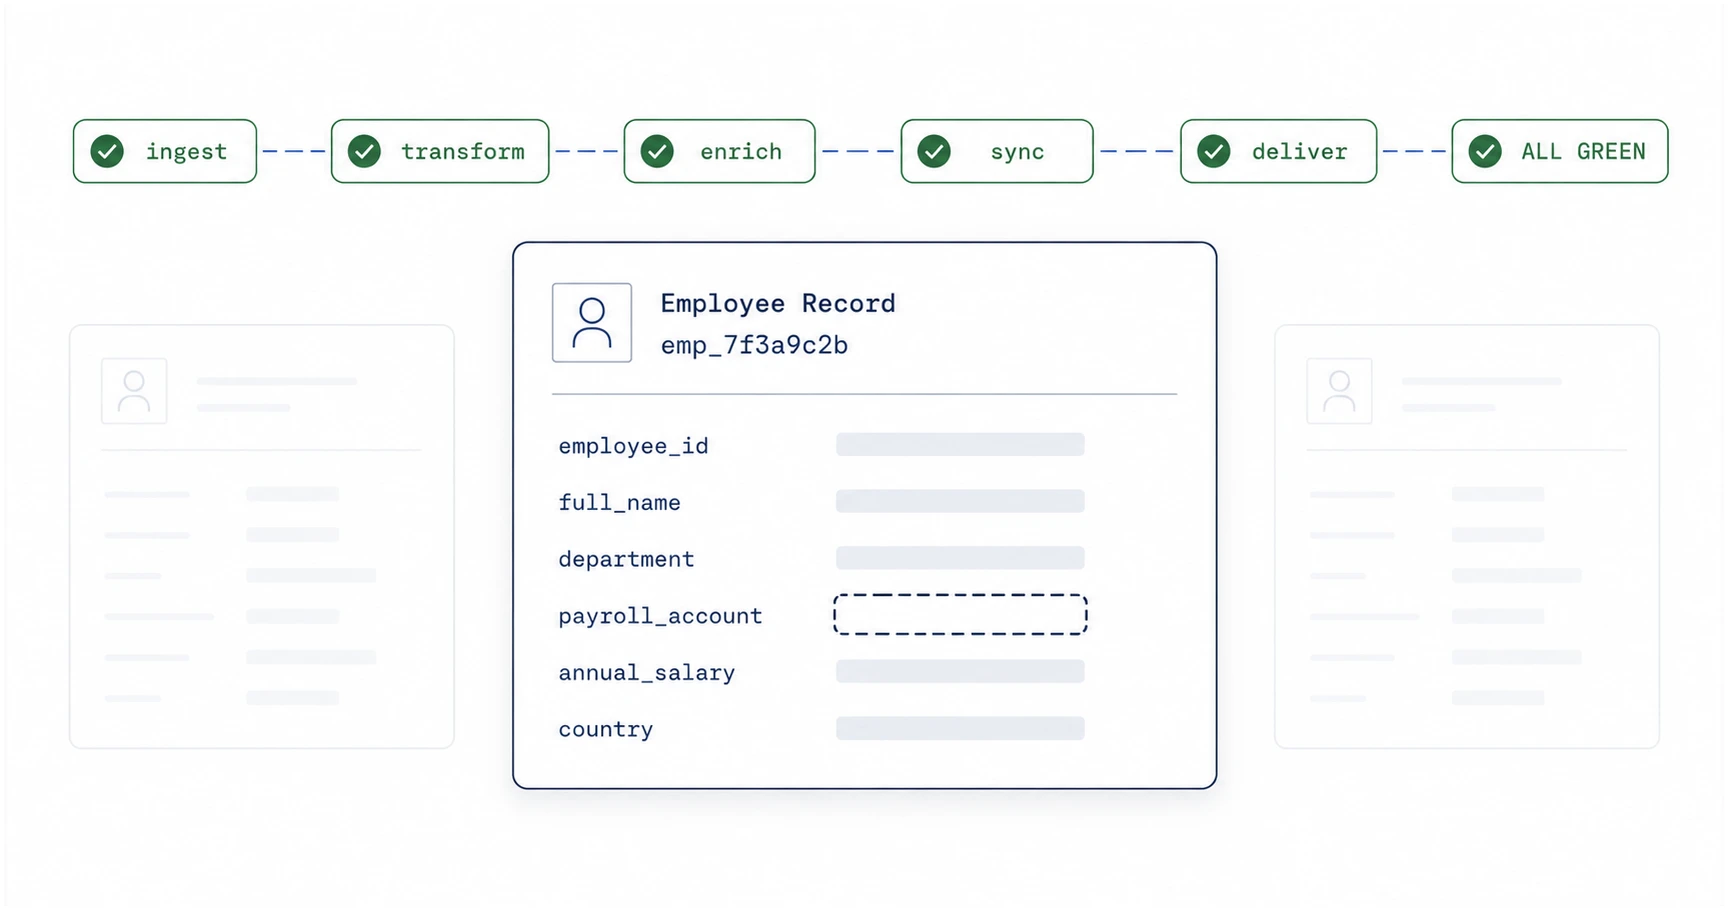
The sync ran. Every dashboard was green. The new regional manager still got paid as if she were an hourly contractor, because one field — her FLSA classification — never made it from Workday to the payroll system.
Nobody found out from a monitor. They found out from her, eleven days later, after the check cleared light. By then the run that caused it had aged out of three different logs, and the engineer assigned to figure out what happened started where these always start: clicking through tools, trying to reconstruct a single employee's path through a stack that has no idea the employee exists.
This post is about the gap that makes that normal, and what closes it. The argument is simple: the difference between "the sync ran" and "the sync did the right thing" is a trace, and most HR integration stacks don't have one. HR data observability is what you call it when you do.
"Green" answers the wrong question
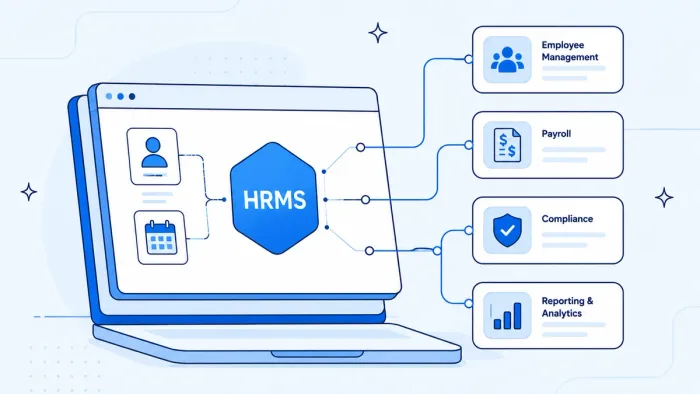
Run a new-hire or comp-change event through a typical HR stack and it touches a lot of surfaces. The HRIS is the system of record. Downstream sit payroll, benefits, the LMS, IT provisioning, badging, a data warehouse, and whatever else accreted over five years of "can you also sync this." Eight to twelve consumers is normal. Each one has its own logs, its own retention window, its own idea of what a successful response means.
When the platform lead says payroll integration is healthy, what that actually rests on is a handful of signals that each answer a narrower question than they appear to:
- The automation tool shows no errors on its last batch of runs — meaning it dispatched, not that the destination accepted the full record.
- The workflow runner responds to a health check — meaning the process is up, not that last night's run wrote every field.
- The payroll API returned
200— meaning the request was well-formed, not that the field you cared about was in it.
None of those see a partial write. A record can arrive with the FLSA classification dropped, the destination accepts it, the meter logs a success, and every dashboard stays green. The data is wrong and the monitoring is right, because the monitoring was watching the pipe, not the payload.
Monitoring tells you the workflow ran. Observability tells you what it did to one person's record. Payroll runs on the second question.
Why the HR stack is dark by default
Engineering teams are not bad at observability. They run real APM on their services. They have distributed tracing on the backend. The integration layer is the dark patch on the service map, and it's dark for a structural reason, not a sloppy one.
Integration tools, as a category, were built to log, not to trace. A log says an activity happened. A trace says what happened to this customer's request as it moved across systems. When a new-hire event leaves the HRIS and fans out to seven destinations, nothing assigns it a shared trace ID that survives the whole journey. Each hop records its own fragment in its own format. There is no thread you can pull to follow one employee from the system of record to the paycheck.
So when payroll comes out wrong, you can't ask the question you actually have, which is what happened to her record on Tuesday's run. No tool in the chain was built to answer it. You ask the questions the tools were built for instead: is it up, did it error. All green. The failure that matters lives in between them, in the seam where one system handed a thinner record to the next and both called it a success.
What the trace shows you
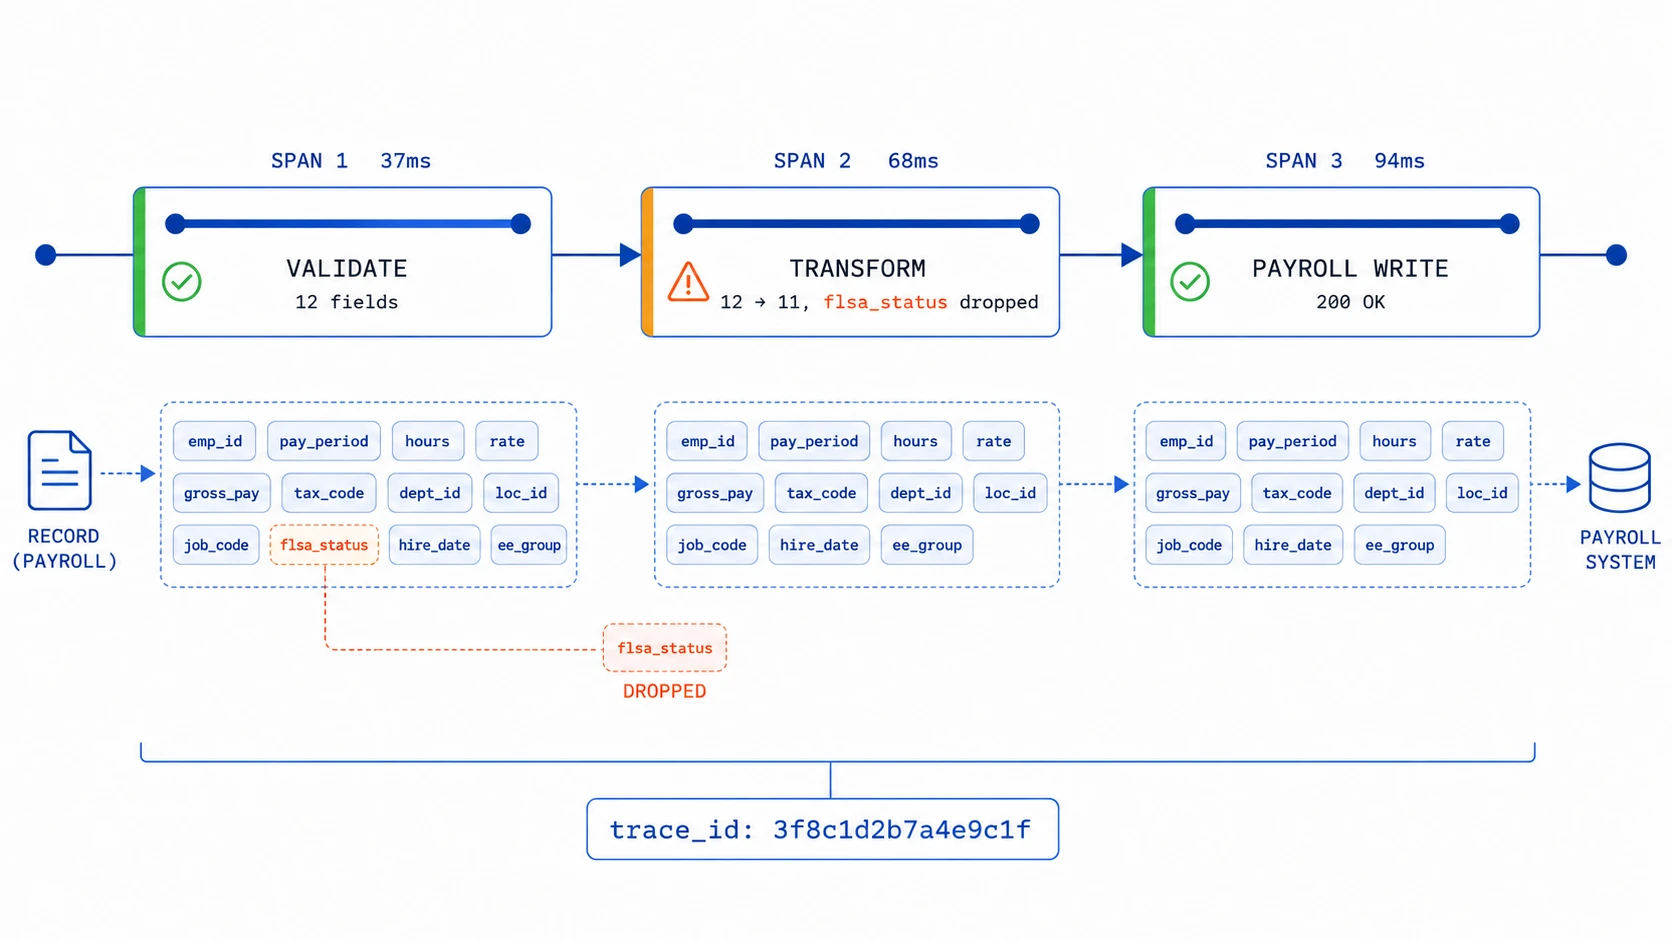
Here is the same failure in a stack with HR data observability, where every activity in the workflow emits an OpenTelemetry span and the whole run carries one trace ID.
The comp-change event leaves the HRIS. You open the trace for that employee and that run. The validation span is green: the inbound record had all twelve fields. The transform span is where it goes wrong. The mapping that flattens the HRIS schema into the payroll schema silently dropped flsa_status, because a field got renamed upstream in a release three weeks ago and the mapping was never told. The payroll-write span is green, because the payroll API was handed eleven fields and has no opinion about the twelfth it never saw.
You found the dropped field in the time it took to read three spans. Not which tool was up. Which field, in which step, on which run, for which person. That's the distance between monitoring and observability, and on a payroll failure it's the distance between an eleven-day-late discovery and a same-day fix.
Two things make that trace worth more than a prettier dashboard:
- It's indexed by attributes you care about. Filter by
employee.id, byevent.type, by workflow version, by the run window. You ask operational questions — show me every comp-change last cycle where the destination wrote fewer fields than it received — instead of the three the vendor anticipated. - It rides an open standard. Because it's OpenTelemetry, the spans export into the observability backend you already run for the rest of production. The payroll failure stops being its own special category investigated in a separate console with a separate login. It's just an incident, debugged with the normal tools by whoever's on call.
Why "on every tier" is the part that matters
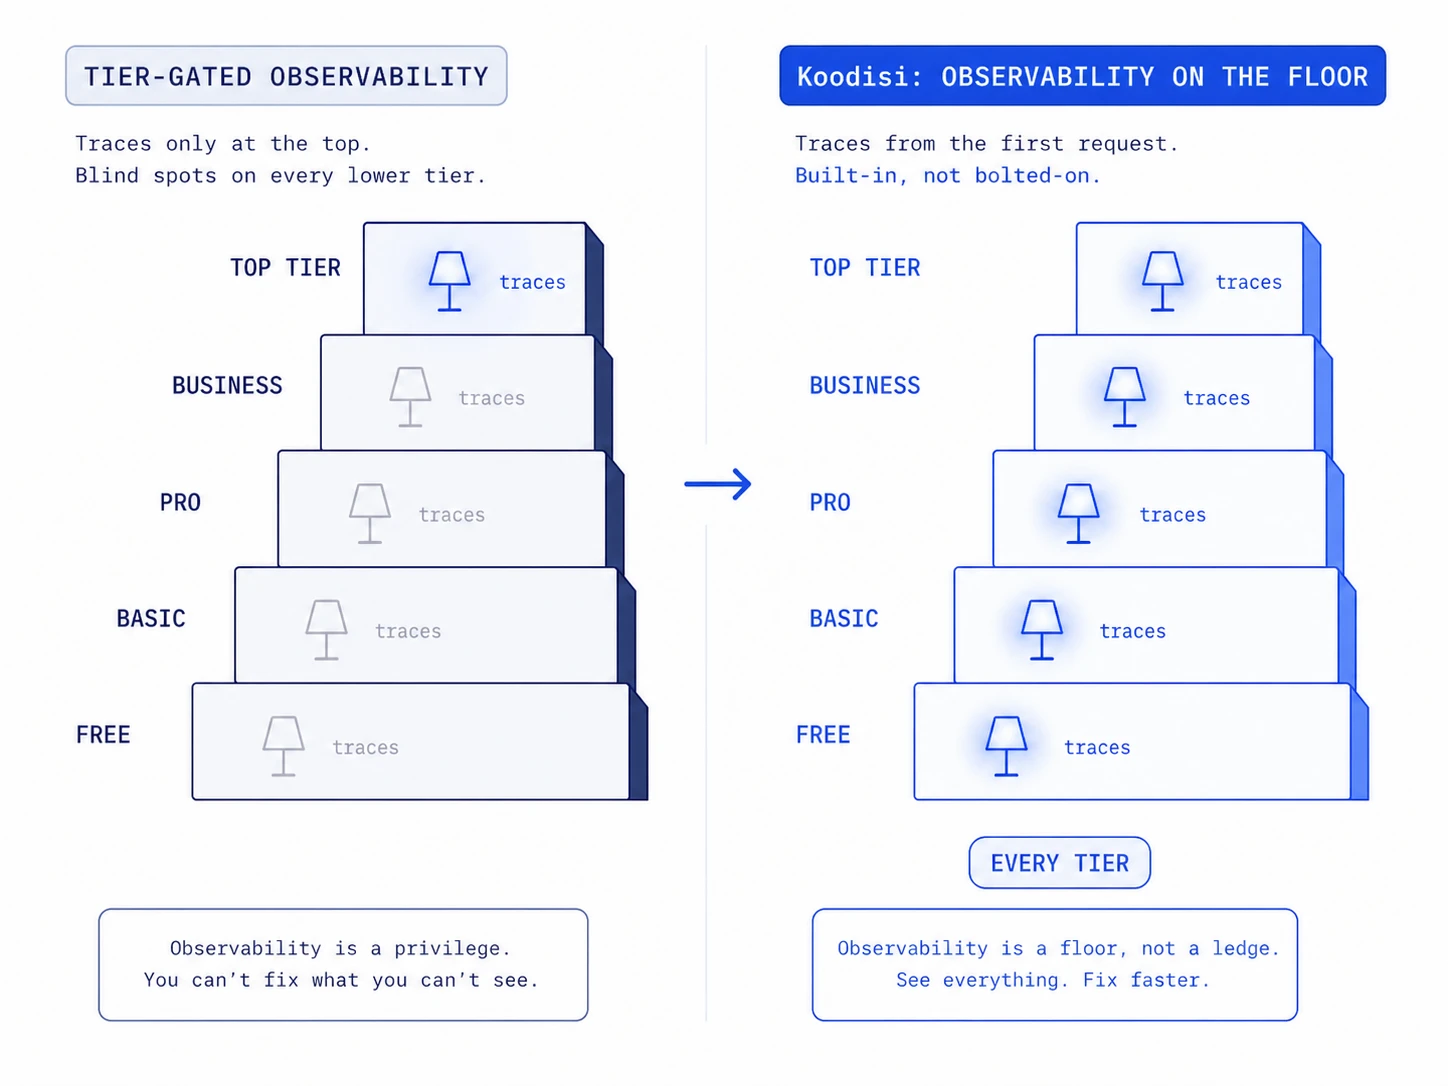
Plenty of platforms will sell you observability. The catch is almost always the same: real trace export lives on the top SKU, and below it you get screenshots. So the teams most likely to be running an unobserved payroll sync, the ones who haven't signed a six-figure enterprise contract, are exactly the ones who can't see into it.
This is where the model matters more than the feature. OpenTelemetry traces ship on every Koodisi tier, including the free Community tier. The trace from the HRIS event follows the record through the transform, the payroll write, the benefits update, and the provisioning step, and it lands in your stack — on day one, at $0, before any procurement conversation. Observability isn't the thing you graduate into after the failure that justifies the upgrade. It's the default you start with.
The same logic runs through the rest of it. Workflows are real Git files in your own repo, so when payroll comes out wrong the question "what changed in this mapping, and when" is answered by git log and a diff, not by reconstructing intent from a vendor's audit trail. You branch in the platform and raise the PR through your existing GitHub or GitLab flow. And the pricing doesn't punish you for being observable: no per-execution billing, no overage invoices, so trace data is never an upsell and you're never auditing your own runs to keep the meter down. There's a sane fair-use ceiling, the way there is on any real system. What you're buying is the absence of the surprise invoice, not a promise of infinite compute.
People route around systems they can't see into. Owning your telemetry is what keeps payroll inside the tent instead of being the black box everyone works around.
Where this doesn't earn its keep
If the integrations in question are genuinely disposable — a Slack ping when someone updates a profile photo, a sync nobody would notice failing for an afternoon — none of this is worth the overhead. A lightweight tool is the right call, and tracing a notification is effort aimed at a problem you don't have.
Data observability earns its keep on the integrations where a silent partial write costs someone real money or puts you on the wrong side of an audit. Payroll, benefits, anything a regulator can ask about. That's a narrower set than your whole integration sprawl, and the honest move is to put observability where the records are sensitive and skip it where they aren't.
Try it on the sync that worries you
Pick the HR integration you'd least want to explain to a regulator — the one between the system of record and the thing that pays people. Ask one question about a specific run from last week: for one employee, did every field that left the source arrive at the destination?
If you can answer that without opening more than one tool, your stack is in better shape than most. If you can't, that gap is where the late paycheck lives.
You can build the observable version of that one workflow on the free Community tier in about ten minutes, point it at a real environment, and watch where the trace lands. Run a comp change through it and drop a field on purpose. See how fast you find it. That's a better basis for the call than anything on this page.