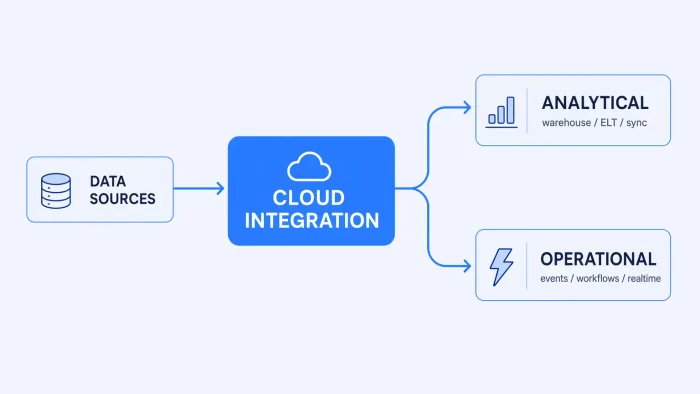
You've moved data between systems in more ways than you'd care to admit. A zap syncing CRM updates to a billing table. A Python script in a cron job that someone wrote before you joined and nobody touches anymore. A Lambda function on an SQS trigger that mostly works. One expensive recipe holding the critical path together.
Each piece solved a specific problem at a specific moment. Collectively, they form your integration layer — the substrate that keeps your systems agreeing with each other about what's true. At some point in the last few years, that substrate quietly became load-bearing, without anyone declaring it so or treating it accordingly.
Data integration is usually defined as "moving data between systems" or "connecting disparate data sources." That definition was fine when integrations were occasional plumbing tasks. It's not adequate for what most engineering teams are actually running today. The gap between the textbook definition and production reality is where teams get burned, and where most vendors stop explaining.
The definition problem
Ask "what is data integration" and you'll get ETL pipelines, connectors, transformation logic. All technically correct. None of it tells you the part that matters operationally.
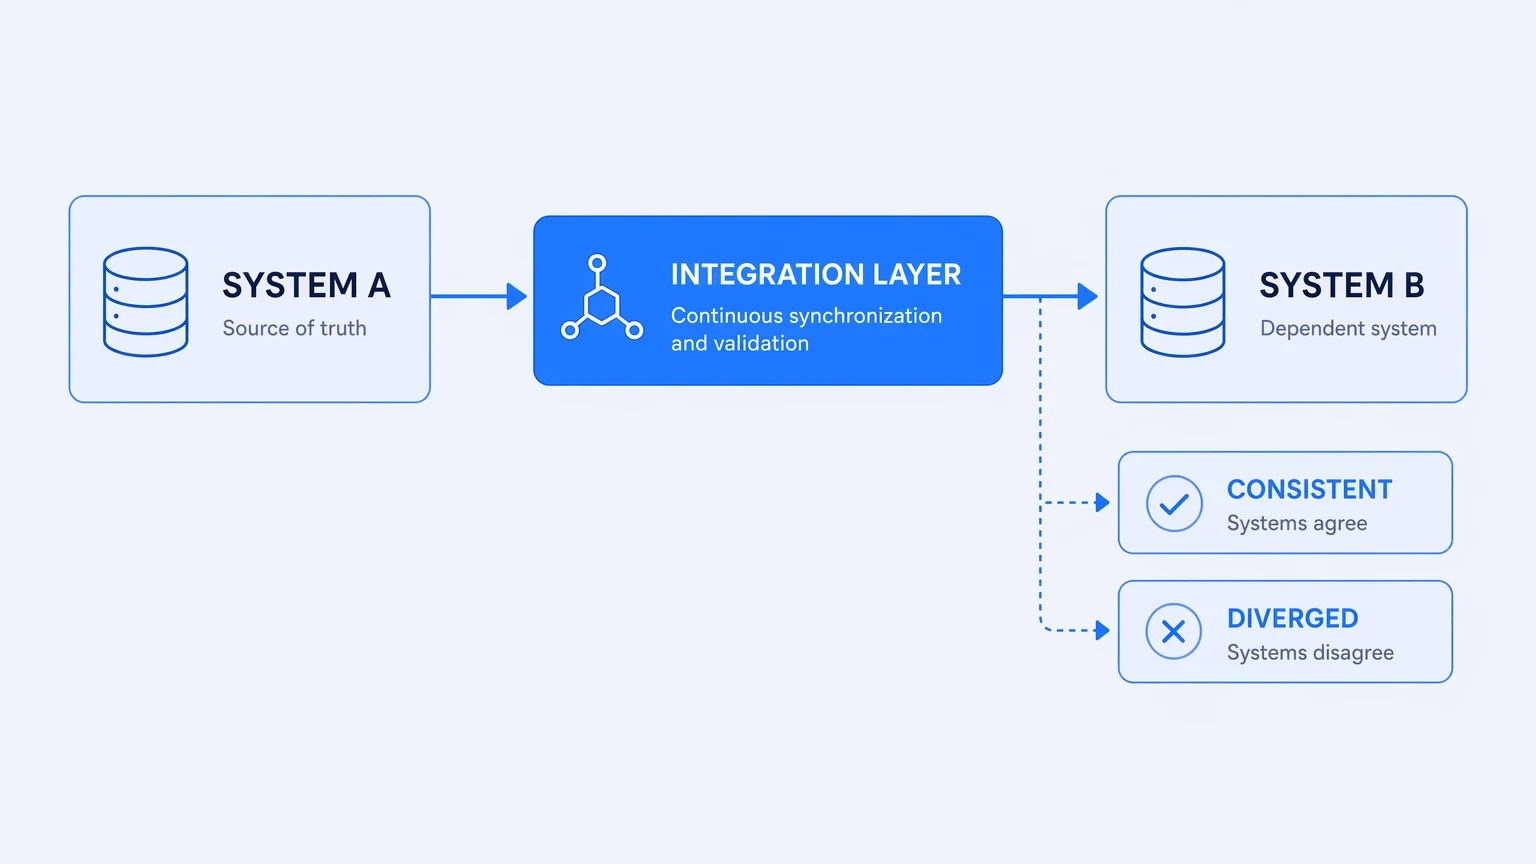
A sharper definition: data integration is the practice of keeping multiple systems consistent with each other, reliably, over time, at the latency and fidelity the business requires.
The difference is load-bearing. "Moving data" treats each transfer as an event. "Keeping systems consistent, reliably, over time" treats integration as a continuous obligation — one with failure modes, SLAs, debugging surfaces, and cost behaviors the owning team must understand and govern.
An event can be scripted. An obligation needs to be engineered.
The category definition hasn't caught up with how load-bearing integration has become.
Integration patterns: what's actually different in production
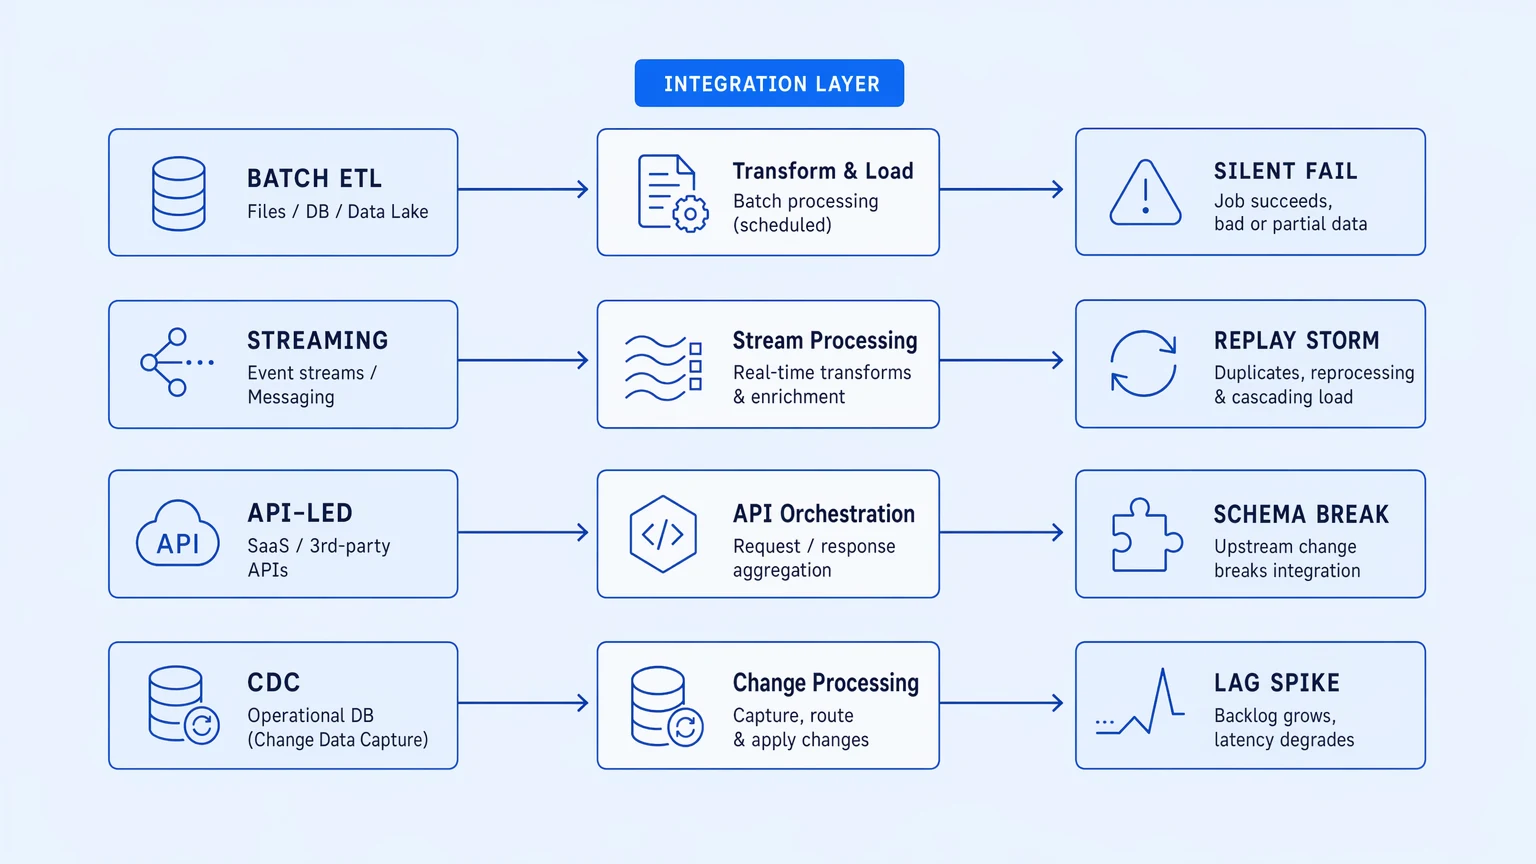
The vendor literature covers the pattern taxonomy — ETL, ELT, streaming, batch, event-driven, API-led, change data capture. Real distinctions, real architectural consequences. But they're not what separates working production integrations from broken ones.
What separates them is whether the team knows when something went wrong, why, and how to recover.
Batch ETL is the oldest pattern and still the most common. The failure mode isn't the batch logic — it's the silent failure. The job finishes with exit code 0. The data is stale, partial, or wrong. Nobody finds out until a dashboard is wrong and a person happens to look at it.
Event-driven and streaming patterns solve the latency problem but surface a different one: exactly-once delivery is hard, and at-least-once delivery means your consumer needs to be idempotent. Most aren't, by default. When a message gets replayed after a consumer crash, "we'll handle it later" is a contract you've signed with 2 a.m.
API-led integration is architecturally cleaner — each integration is a versioned call to a stable interface — but it introduces coupling you have to actively manage. When an upstream API changes its schema or starts rate-limiting you, the integration breaks. If you don't know the integration was the critical path for three downstream systems, you find out the hard way.
Change data capture (CDC) is powerful for keeping a warehouse or downstream system in sync without hammering the source database. It also requires understanding the replication log format, handling schema migrations, and deciding what to do when lag spikes. "The replication lag is six hours" is a fact. "The replication lag is six hours and we're not alerting on it" is a production incident in waiting.
Every pattern produces failure modes that are invisible to anyone not actively looking. That's the production gap. An integration can be architecturally sound and operationally opaque at the same time.
The pattern you pick matters less than whether you can see the pattern running.
The observability gap is structural, not accidental
Most teams discover the observability gap after an incident. A customer reports missing data. Engineering digs through platform UIs, correlation IDs, webhook logs. Thirty minutes later they've assembled the story from six different places. The fix is one line. The debugging is the workday.
Not because the engineers didn't instrument properly. Because most integration tooling was built assuming integration failures are edge cases — that the happy path is the main surface to observe and the failure mode is a secondary concern.
That assumption was plausible when integrations were occasional tasks. It is not plausible when an integration handles customer provisioning, financial reconciliation, or the pipeline feeding your AI features. Those are first-class production systems. They need the same debugging surface as everything else: structured traces you can filter, spans that show where time went, failure events with full payload context and a replay path.
The gap isn't that the data doesn't exist. Integration platforms run every step and know what happened. The gap is that most don't emit that data in a format you can query the way you query the rest of production — through a trace, filtered by customer ID, in the observability stack your on-call team already has open.
Enterprise platforms have historically patched this with dedicated consoles: a platform-specific log viewer, a platform-specific execution history, a platform-specific alert surface. Better than nothing. Still silos. When an incident touches both the integration layer and the application layer simultaneously — which it usually does, because they're entangled — you're debugging two systems with two tools, stitching the story manually.
OpenTelemetry exists to close this gap. A trace is a trace whether it comes from your web tier, your job runner, or your integration platform. If the integration emits OTLP spans, the on-call engineer filters to a customer ID in the same tool they use for everything else and follows the request through. The story assembles itself.
Most integration platforms know exactly what happened during a failure. The question is whether that knowledge lives somewhere your team can reach it.
The cost model is a reliability concern
This is the part most architecture conversations skip.
When your integration layer runs on usage-metered pricing, your cost structure is tied to your traffic. That seems reasonable until you think through the failure scenarios.
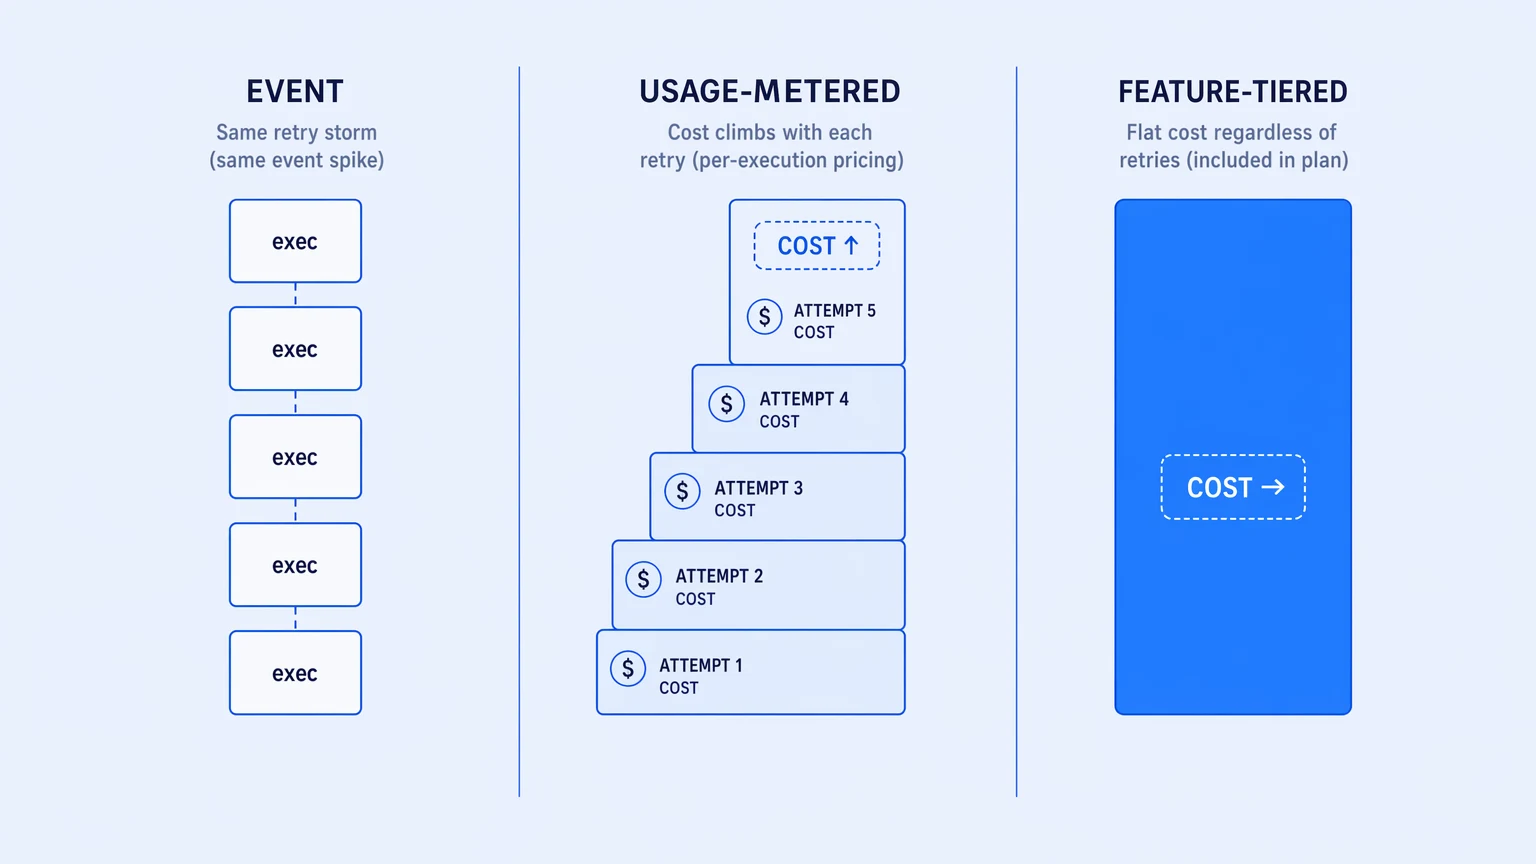
A retry storm. An upstream API returning 500s, the integration retrying with backoff. A webhook replaying events after a processing error. A loop running more iterations than expected because input data was malformed. Usage-metered platforms charge for every attempt, including the failed ones. The bill for the incident adds to the operational pain of it.
This creates a quiet incentive problem. Teams on usage-metered platforms have a financial reason to keep integrations small, to avoid moving too much through the platform, to architect around the meter rather than toward the right data model. They won't name it that. They'll say they didn't want to over-engineer it. But the financial structure is doing real architectural work on the system.
Feature-tiered pricing — cost scaling with capability tier, not execution volume — removes that incentive. Run more through the platform; the bill doesn't move. A retry storm is an operational event, not a billing event. Promoting a workflow from prototype to production is a reliability win, not a line-item increase.
To be precise, because vague pricing claims are one of the category's oldest failure modes: "no per-execution billing" means no overage invoice when traffic spikes. It doesn't mean compute is free or unlimited. There's a sane operating ceiling, as with any real system. The point is the bill doesn't move in proportion to execution volume — that's the behavior that warps architecture decisions.
Your pricing model is an architectural constraint. Choose it as deliberately as you choose your data pattern.
What "enterprise data integration" actually requires
The enterprise label in "enterprise data integration" usually invokes scale, governance, and security. Right dimensions. Often deployed to justify price rather than specify behavior.
Here's what they actually demand in practice.
Scale means the integration layer absorbs load growth without architectural rework and without a proportional cost increase. It also means the team knows the platform's limits before they hit them in production.
Governance means every change to integration logic is versioned and attributable. There's an audit record: who changed what, when. Integration logic is a software artifact — branched, reviewed, deployed — not a flowchart in a vendor's database with no diff history.
Security means secrets are managed, access is scoped, and the integration layer doesn't open a path through your perimeter that bypasses every other control you've built. In practice it also means the integration layer participates in your existing SSO and identity model, not a parallel one.
These aren't checkboxes on a comparison sheet. They're operational behaviors that either show up in production or don't.
For teams evaluating from this angle — not "what connectors do you have" but "how does this behave at 3 a.m." — Koodisi was built to answer those questions first. OpenTelemetry on every tier, real Git versioning with in-platform branching and PRs through your existing GitHub or GitLab flow, no per-execution billing. Community tier is free to start, no credit card required.
The longer argument about what owning your integration layer actually means — versus renting access to it — lives in why unobservable integration stacks are the real hidden bill.