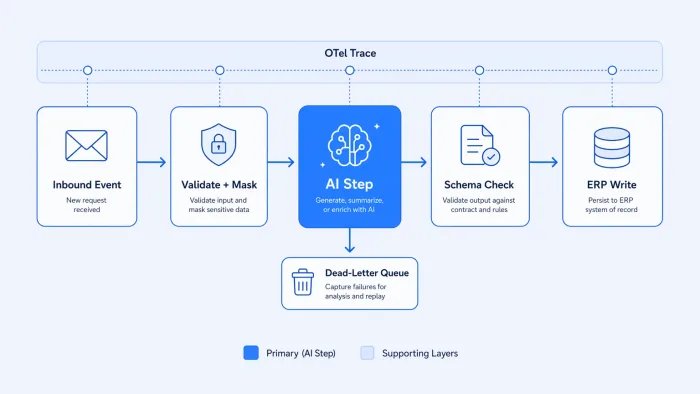
You promoted the workflow on a Thursday. By Monday it was in production handling real volume. By Tuesday, a customer reported a data discrepancy nobody could explain. You opened the automation platform, clicked through the execution history, found no errors, and spent the next three hours tracing what actually happened — a combination of application logs, a Slack thread, and a colleague who remembered changing something two weeks ago.
That's the story enterprise workflow automation rarely tells about itself. The tools got you to deployment. Getting you through the incident was a separate problem — the same gap between having the technology and having enterprise integration as a discipline.
Most guides to enterprise workflow automation cover the same terrain: what it is, ROI calculations, a feature checklist, a vendor list ranked by G2 score. Fine for what it is. But if you're past the "should we automate this" question and into "why is this hard to maintain in production," those guides don't help.
This post is for the second question — for the baseline definition and failure modes first, see what workflow automation actually is.
The reliability gap isn't where you think it is
The standard pitch for enterprise workflow automation is that it replaces fragile scripts and manual processes with something structured and monitored. The problem is that "monitored" means very different things across platforms, and the difference only shows up in production — not during evaluation.
Most automation platforms give you execution logs. You can see whether a workflow ran and whether it completed. What they don't surface is the thing engineers need during an incident: a trace across every step, with timing, payload shape, and failure context — something you can hand to a colleague and say "here's exactly what happened to record 3,847 at 2:14 AM."
Without that, debugging a production failure in the automation layer is archaeology. You compare timestamps from one system against records in another. You check whether the API downstream actually received the payload or just acknowledged it. This isn't a failure of engineering sophistication. It's the design of most automation tooling: logs for success confirmation, opacity for failure diagnosis.
Most enterprise workflow automation platforms were built to answer "did it run?" not "what did it do and why did it fail?"
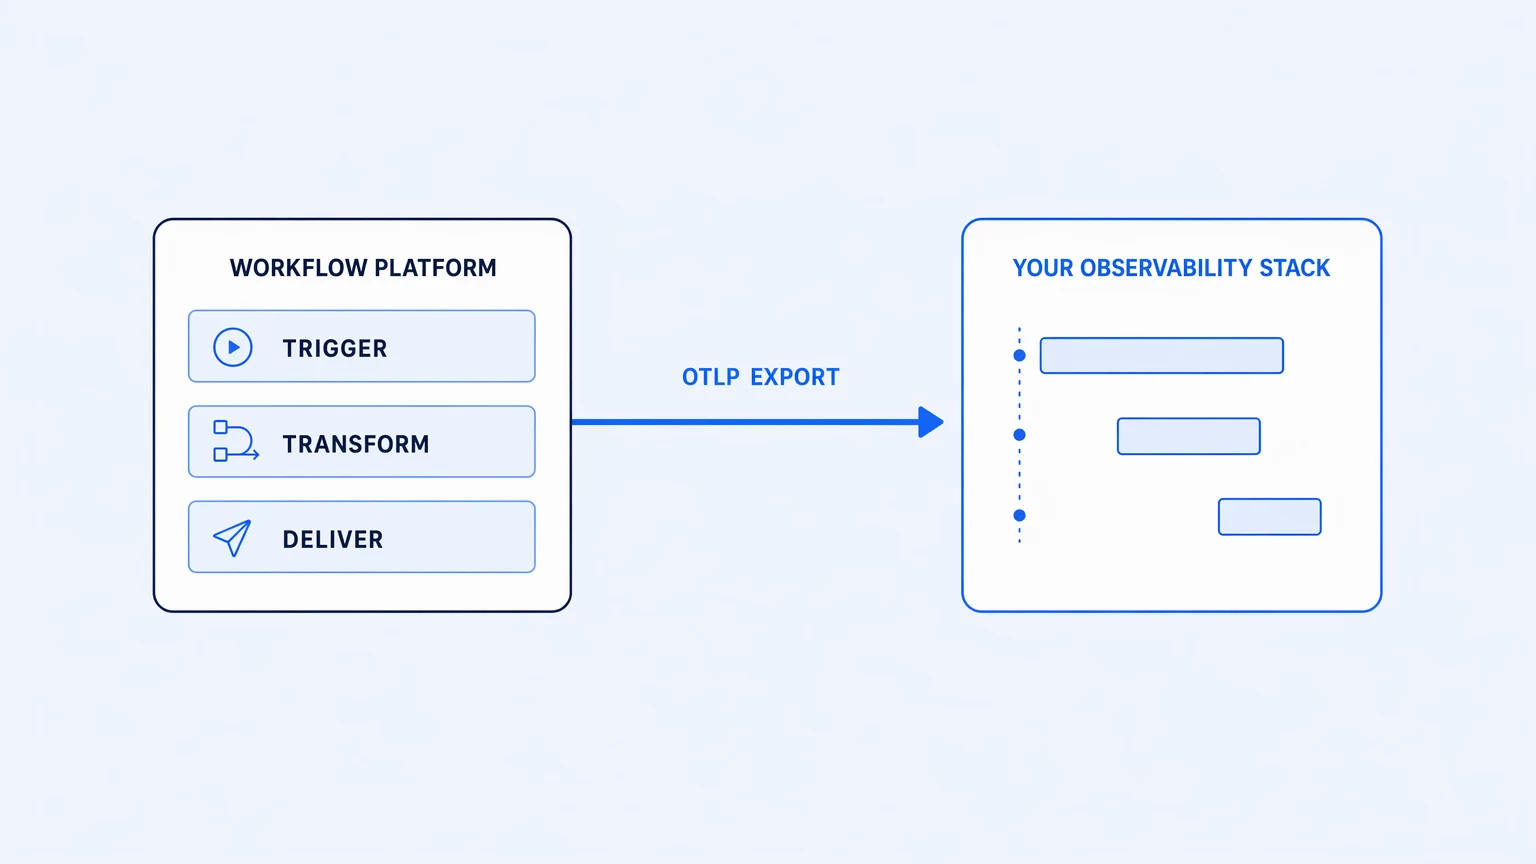
The way out is treating observability as a first-class requirement, not an add-on. OpenTelemetry — the open standard for distributed traces, metrics, and logs — is the relevant benchmark. A platform that emits OpenTelemetry traces across every workflow step lets you route that telemetry into whatever stack your team already uses: Datadog, Grafana, Honeycomb, Elastic. Your integration traces sit beside your application traces. Incidents in the automation layer get diagnosed with the same tools as every other production incident.
The question to ask any vendor: does the platform emit OpenTelemetry natively, on the tier you're actually buying, and can it export to your existing stack? Not "does it have a dashboard." Dashboards are a product decision. Exportable telemetry is infrastructure.
The bill behavior problem is a production problem, not a pricing problem
When automation platforms describe their pricing, they lead with per-flow or per-task metrics. During evaluation, you estimate volume, multiply by unit cost, and get a number that seems manageable.
Production doesn't cooperate with that estimate.
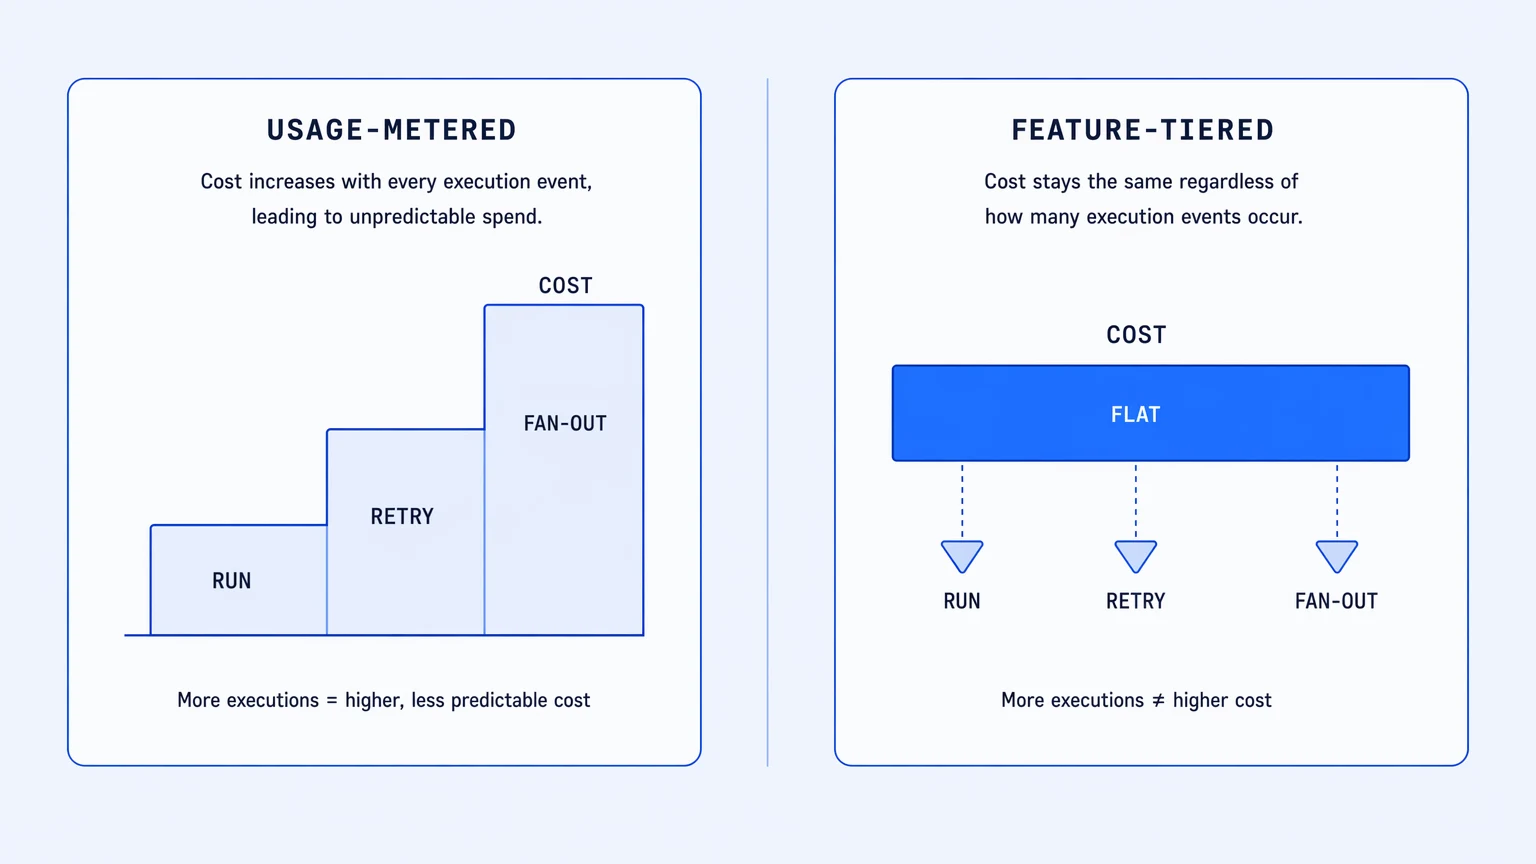
Retries happen. Workflows fail and retry. On usage-metered platforms, both the failure and the retry count against your quota. A workflow that processes 10,000 records, hits a downstream rate limit, and retries each record once just consumed 20,000 units. You didn't get twice the work done.
Fan-outs count. A workflow iterating over 500 items and making one API call per item may count as 500 tasks, depending on how the platform meters. Parallel branches may each count separately. These aren't edge cases — they're the normal shape of production integration work.
Unexpected volume arrives. You estimated average load. Traffic spikes. A backfill job runs. Someone triggers a bulk export at the wrong time. On a usage-metered platform, that spike becomes an invoice line item you didn't budget for. On a feature-tiered platform, your bill doesn't move.
Your billing model predicts your incident response options. If a runaway workflow doubles your invoice, your first instinct is to shut it down — which may be exactly the wrong call for data integrity.
Pricing model choice is an engineering decision, not just a procurement one. The way a platform charges for executions determines how your team responds under load — what you feel safe doing in production, and what you throttle preemptively because you're watching the meter. Running an integration 10 million times this month on a flat-rate platform is a non-event. On a usage-metered platform, it's something you negotiate with yourself about.
Pricing model isn't a vendor detail — it's a property of your production system.
Code ownership is an operational requirement
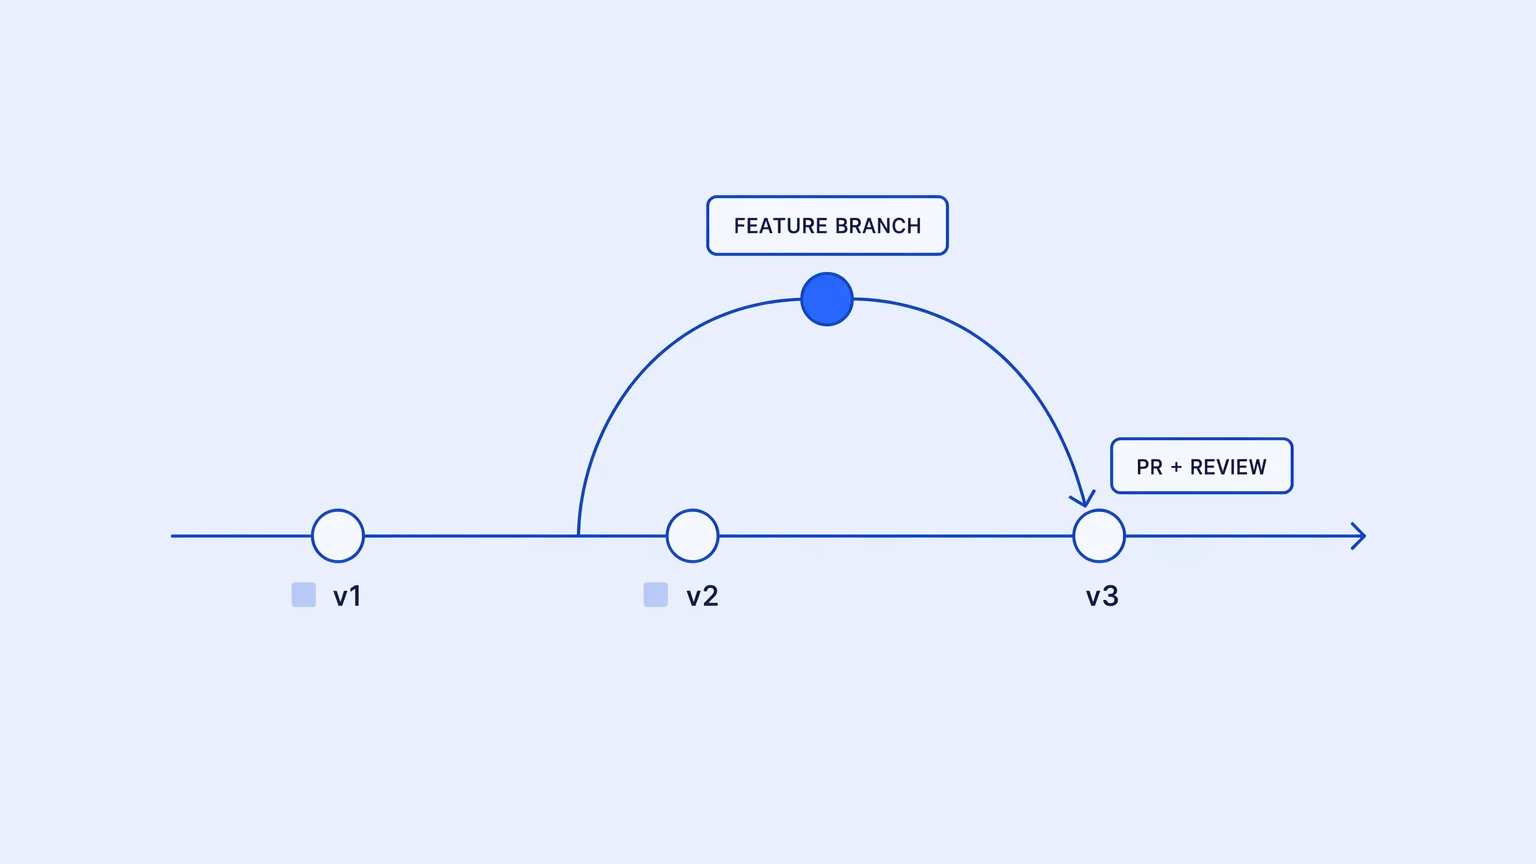
The question that surfaces fastest in any post-incident review: what changed in this workflow, when, and who approved it?
For most automation platforms, that answer lives in the vendor's audit log. You can see that something changed. You can see the timestamp. You cannot take that audit log to a colleague and run a git diff. You cannot roll back by checking out a previous commit. The logic is stored in the vendor's database, and your access to its history is mediated by whatever UI they chose to build around it.
That's renting. The workflow exists, but the code artifact — the thing you can inspect, diff, branch, test, and roll back — doesn't live with you. Fine for throwaway automations. A real liability for workflows that handle billing events, onboarding sequences, or anything that could be audited.
Ownership in practice means the workflow definition is a versioned file in your source control — same repository that holds your application code, governed by the same review process. You branch to make a change, raise a pull request through your existing GitHub or GitLab flow, get it reviewed, and merge. The change history is git log. The rollback is a revert commit. The integration layer is software, held the same way you hold everything else.
Documentation drift is real. A diff-able, version-controlled workflow artifact is significantly less susceptible to it than a flowchart diagram that someone updated six months ago and forgot to re-export.
Onboarding a new engineer to a Git-versioned integration takes an afternoon. Onboarding them to a vendor-database-stored flow takes however long it takes to read screen after screen of vendor UI.
The longer argument for why the integration layer belongs in your repo — and what changes operationally when it does — is in why unobservable integration stacks are the real hidden bill.
The honest tradeoff
None of this comes free. Git-versioned workflows require that your team actually treats integration logic as code — code review discipline, branching conventions, an onboarding path for operators who are more comfortable in a visual editor than in a repository. If the people maintaining your automations are non-engineering staff, a platform that keeps everything inside a visual vendor UI might genuinely serve them better, observability and billing model tradeoffs aside.
Full OpenTelemetry export is only useful if you have a stack to receive it. If your team doesn't run Datadog or Grafana or equivalent, a built-in dashboard showing execution counts and error rates might be sufficient. Know which situation you're in before weighting that requirement heavily.
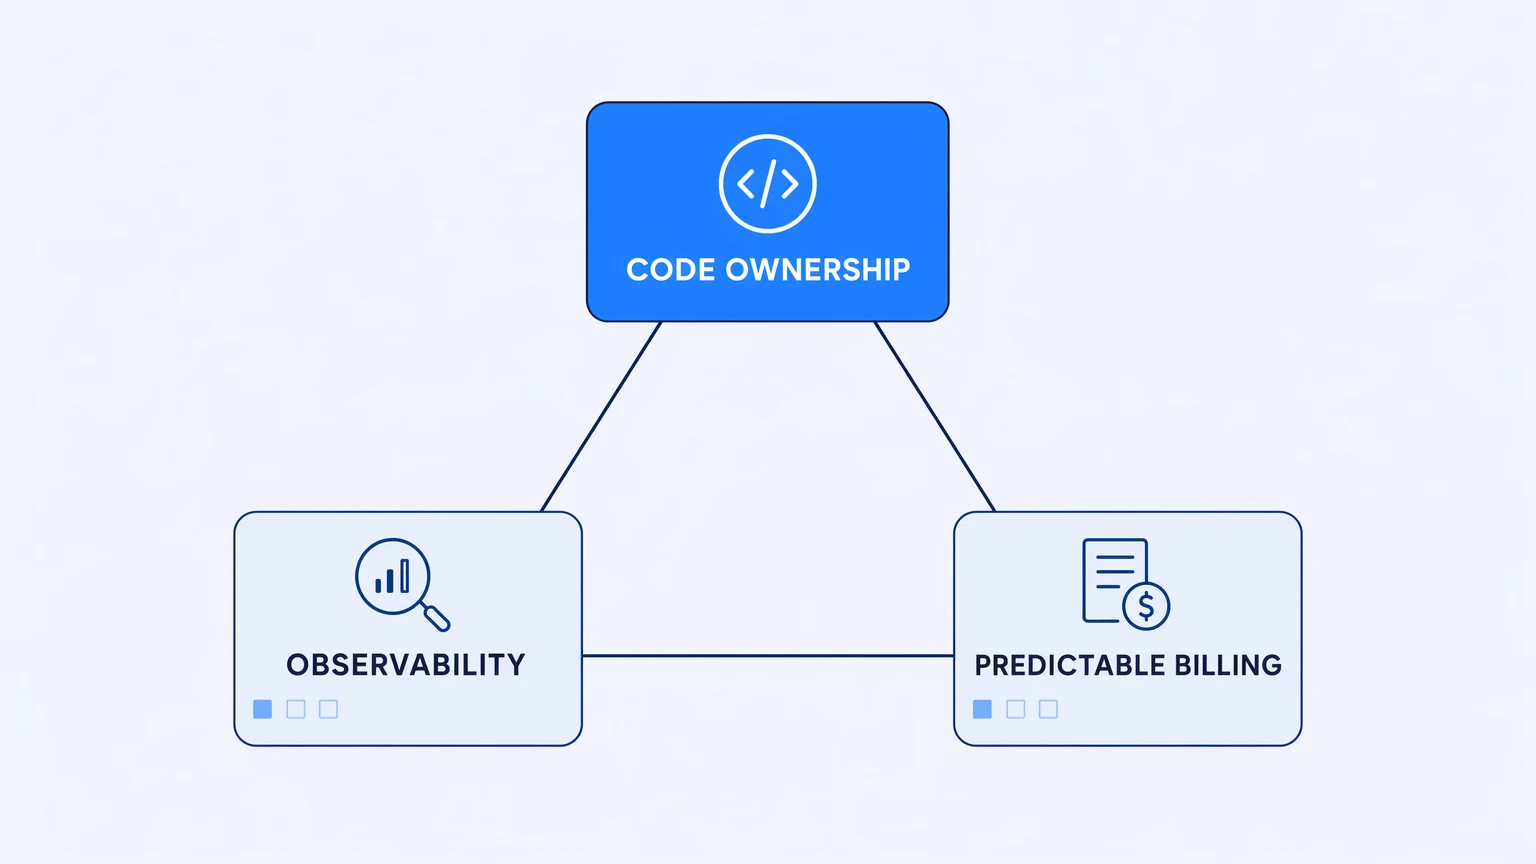
The three properties — trace-level observability, non-metered billing, code ownership — matter most to teams running automations that are genuinely load-bearing: billing pipelines, onboarding flows, data sync jobs, anything where failures cascade downstream and volume is hard to predict in advance. For lower-stakes automations, a simpler platform is a reasonable choice.
What to actually look for
If you're evaluating platforms and the workflows you're automating are production-critical, here are three things to verify before committing:
- Observability output: Does the platform emit OpenTelemetry traces, not just UI logs? Can you export them to your existing stack? On which tiers? Ask for a live trace from a test execution, not a screenshot of their dashboard.
- Billing under load: Run their pricing model against your worst-case scenario — a workflow that retries every record in a large dataset, or a fan-out that touches 10,000 items. What's the invoice? Is that number a function of traffic, or of the plan tier?
- Logic location: Where does the workflow definition live when it's deployed? Can you retrieve it as a file, view its diff history, branch it, and roll it back without logging into the vendor UI?
These aren't trick questions. They're engineering requirements for any system that handles load-bearing production work. Most platforms can answer two of them adequately. Finding one that answers all three cleanly is the real evaluation.
Koodisi ships OpenTelemetry on every tier from the free Community plan, charges no per-execution overages on Professional and above, and stores workflow logic as real Git files in your own repository — branch in the platform, raise PRs through your existing GitHub or GitLab flow. If your team is at the point where the current automation setup feels like debt rather than infrastructure, it's worth a trial: koodisi.io/start.