
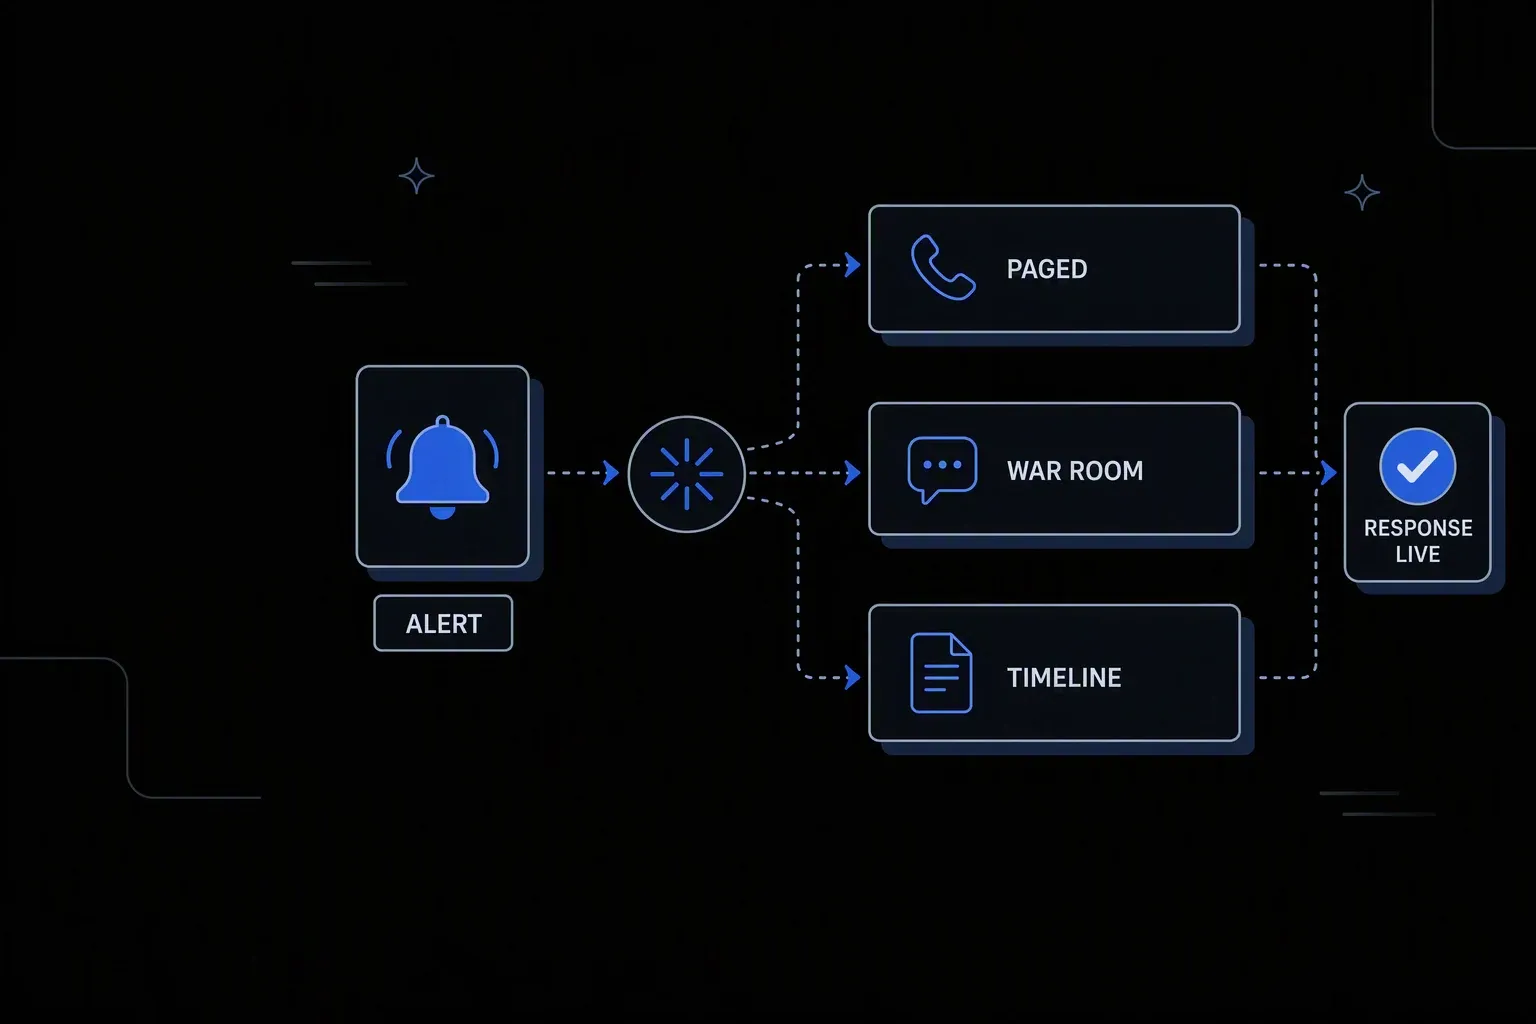
Incident Management Automation
Respond to incidents faster with automated detection, routing, and war room creation.
Response starts immediately
Shorter time to engage
The right responders are paged with context the moment an incident is declared, not after someone assembles the picture.
One timeline
Coordinated response
Engineering, support, and leadership work from the same record instead of three parallel conversations.
Postmortem writes itself
Faster learning
The timeline is captured as the incident runs, so the review starts from facts rather than reconstruction.
One governed workflow across systems that never talked.
- Who it's for
- IT operations and engineering teams coordinating incident response across monitoring, paging, ticketing, and communication tools.
- What it does
- A workflow that turns an alert into a coordinated response — paging, ticketing, comms, and timeline — without manual assembly.
- Systems involved
- Your monitoring, paging, ITSM, and messaging platforms — connected through the REST Client, with dedicated activities built on request.
- How it stays governed
- Escalation rules in decision tables, scoped permissions, and a complete incident timeline per event.
What this looks like today
The friction that makes this workflow expensive to run by hand.
Assembly
The first ten minutes are logistics
Declaring an incident means opening a ticket, starting a channel, paging people, and telling stakeholders — all by hand, while the issue continues.
Fragmentation
Response splits across tools
Discussion happens in chat, status in the ticket, and updates in email, so no one place holds what is actually happening.
Reconstruction
Postmortems start from memory
Rebuilding the timeline after the fact takes hours and produces an account nobody fully trusts.
The workflow
How Koodisi runs it
Koodisi automates the incident response lifecycle — from detection to war room creation, stakeholder notification, and post-incident reporting — reducing MTTD and MTTR.
Detect and declare
Monitoring alerts and manual declarations enter one process, so response is identical whether a system or a person raised it.
Webhook triggers from monitoring over the REST Client.
Assess severity by rule
Affected service, customer impact, and time of day resolve severity in a decision table, so the response matches the incident rather than the mood.
Severity rules live where operations can change them.
Engage the right responders
On-call rotations and escalation paths are resolved and paged, with escalation continuing automatically if nobody acknowledges.
Escalation timing defined alongside the severity rules.
Set up the response in one step
The ticket, the channel, and the stakeholder notification are created together with the alert context already attached.
ITSM and messaging platforms through the REST Client.
Keep stakeholders current
Status updates flow to the audiences that need them on the cadence severity requires, so responders are not interrupted for updates.
Update cadence defined per severity.
Capture the timeline as it happens
Detection, escalations, status changes, and resolution are recorded live, so the review begins from a factual record.
Execution logging with timestamps throughout.
Connectivity
The systems in this workflow
Koodisi orchestrates the platforms this workflow touches — through the REST Client today, and through a dedicated activity whenever you need one.




The capability underneath
Every workflow above is assembled from the same governed building blocks — which is why connecting one more system is a day of work, not a project.
Connect to anything
- REST and webhook connectivity with managed authentication (4 activities)
- Secure file transfer over SFTP (5 activities)
- Direct database reads and writes (4 activities)
Move and reshape data
- Translate between CSV, JSON, XML, and fixed-width formats (6 activities)
- Field-level mapping between systems that model data differently
- High-volume batch processing with per-record tracking (7 activities)
Decide and protect
- Decision tables for approval and routing rules your team can read
- Encryption, hashing, and signature verification on sensitive fields
- Retry policies, error handling, and full execution logging
Business systems connect through Koodisi’s REST Client, and our team builds dedicated activities for the ones you depend on — typically within a day of you asking.
Request a system →Governance
Automated, but still under control
Every run is authorised, recorded, and observable — the part that decides whether automation survives an audit.
Severity and escalation in a table
What counts as critical, and who gets engaged, is written where operations can review it outside an incident.
A timeline per incident
Detection, paging, escalations, updates, and resolution are recorded with timestamps as the incident runs.
Scoped authority
Permission scopes control who can declare, escalate, or close an incident, so severity retains meaning.
Response itself observed
Traces cover the response workflow, so a paging failure is visible rather than discovered by its silence.
Credentials in Key Vault
Monitoring, paging, and ITSM credentials are stored in Key Vault and referenced at run time.
Customer data masked
Customer identifiers in alert payloads are masked so incident records can be shared broadly.
No. Your paging, monitoring, and ITSM tools keep doing what they do. Koodisi coordinates between them so declaring an incident does not mean operating four tools by hand.
Escalation continues automatically along the path you define, and every escalation step is recorded. Unacknowledged pages are a visible event rather than a silence.
Yes. Rules produce the initial severity, and responders with the right permission scope can change it. The change and who made it are recorded.
The timeline is captured while the incident runs, so the review starts from a factual record instead of several hours of reconstruction from memory and chat history.
Tools used in this workflow
Ship integrations faster. Operate them without chaos.
Less time on auth, retries, and deployment scripts. More time on the integrations your customers are asking for.
Contact Sales